Indicator: Difference between revisions
No edit summary |
No edit summary |
||
| Line 113: | Line 113: | ||
The available default indicators are listed below. | The available default indicators are listed below. | ||
Some of these indicators already perform specific calculations and can be directly used in the project. They can also be [[ | Some of these indicators already perform specific calculations and can be directly used in the project. They can also be [[Indicators Tutorial|modified and extended with adjusted calculation]]s. | ||
It is also possible to implement your own indicator, using an [[Excel|Excel file]]. This Excel file should be imported into your project and assigned to an indicator. Each added indicator is initially empty, and will require some work to set up, but it is highly customizable. | It is also possible to implement your own indicator, using an [[Excel|Excel file]]. This Excel file should be imported into your project and assigned to an indicator. Each added indicator is initially empty, and will require some work to set up, but it is highly customizable. | ||
Latest revision as of 11:42, 13 July 2026

Indicators are named after Key Performance Indicators (KPI), which serve as a means to identify potential improvements and as a metric for the degree to which those improvements have been successful.
Indicators are visible at the top of the interface. Each indicator has a short name and, except for the budget, a progress bar showing current performance. Indicators can also be inspected by clicking on its element in the top bar, which opens the indicator panel.
Score
The progress made on an indicator depends on the absolute score setting of the indicator:
- When selected, the progress is based on the absolute score.
- When not selected, the progress is relative to the calculate score in the current situation. Such an indicator will measure the relative improvements.
In the indicator panel, the indicator's full name is shown in the title, along with a description and indicator progress on the left. On the right part of this panel a calculated SCORE and an EXPLANATION are shown. The SCORE and EXPLANATION are produced by the indicator's Excel Sheet. This Excel sheet calculates a score and explanation, placing them in designated cells. The excel sheet is also able to obtain information from a project using Tygron Query Language (TQL) statements. A change in the project state provides input to the indicator, the indicator spreadsheet performs calculations based on this input and displays the result as output in the indicator and progress panel on the top bar.
To better understand the implementation of the Excel Indicator, please follow the Indicators Tutorial.


The following output labels can be used to show text or numbers in the indicator panel at the top bar.
EXACT_NUMBER_VALUE: A numerical value that is formatted using the unit system selected for your project. Replaces the indicator's progress bar.EXACT_TEXT_VALUE: A text value that will be used instead of the progress bar.
Explanation
This is the text shown in the lower left corner of the Indicator panel during a session. The explanation text can be written in HTML format. The cell should be named EXPLANATION. When using explanation texts, you may also want to include numbers and/ or text output from your excel. For this you can include %s values, which will be replaced by VAR_# cells, starting from VAR_0.

Simple text string as EXPLANATION output
A simple HTML text string as EXPLANATION output can be written as follows:
<p>SOCIAL:%s units total, of which %s are currently protected, %s are planned to be protected, protecting a total of %s units, leaving %s units unprotected</p>
In this string, values from cells named VAR_0 to VAR_4 are being used to output values in the explanation text.
Combining three strings with only a change in category names will cover VAR_0 to VAR_18 and results in the following:
<p>SOCIAL:%s units total, of which %s are currently protected, %s are planned to be protected, protecting a total of %s units, leaving %s units unprotected</p>
<p>NORMAL:%s units total, of which %s are currently protected, %s are planned to be protected, protecting a total of %s units, leaving %s units unprotected</p>
<p>LUXE:%s units total, of which %s are currently protected, %s are planned to be protected, protecting a total of %s units, leaving %s units unprotected</p>
Which looks on the Excel Indicator panel in the project main view like this:

EXPLANATION
HTML table as EXPLANATION output
As the above shows, with many VAR_# variables and categories present, the EXPLANATION field tends to lack clarity. To improve readability of the EXPLANATION output, it is recommended to implement a table format. To simplify the process, we recommend using an HTML table generator, such as: http://www.tablesgenerator.com/html_tables#.
This will result in the following table:
| Housing Units | Affordable Housing | Market Housing | Top Market Housing | Totals |
|---|---|---|---|---|
| Total present | %s units | %s units | %s units | %s units |
| Already protected | %s units | %s units | %s units | %s units |
| To be added to protected area | %s units | %s units | %s units | %s units |
| Total Protected | %s units | %s units | %s units | %s units |
| Remaining unprotected | %s units | %s units | %s units | %s units |

EXPLANATION
Influencing Indicators
During a session, users' actions can influence Indicators, directly by spatial adjustments and spatial TQL statements and indirectly through Grid Overlay results and subsequent Grid TQL statements. It is up to the users to adjust their actions to improve the score on their Indicators. Also note that an action can also have effects on personal indicators of other stakeholders. For example, if a project developer creates a large office park where there previously was a forest, the amount of green will go down, which will negatively affect the goals of a municipality.

The current situation (original) and maquette (planned) situation can be compared by switching between these situations using the buttons in the top bar.


Indicators on the GeoShare
You can also import indicators from the GeoShare. There is a set of indicators made available in the Public Share. It is also possible to import indicators from GeoShare of your domain. Default public share indicators have wiki pages explaining any required project adjustments upon import. For example, some indicators require specific Indicator attributes, an Overlay, or Areas to function.
-
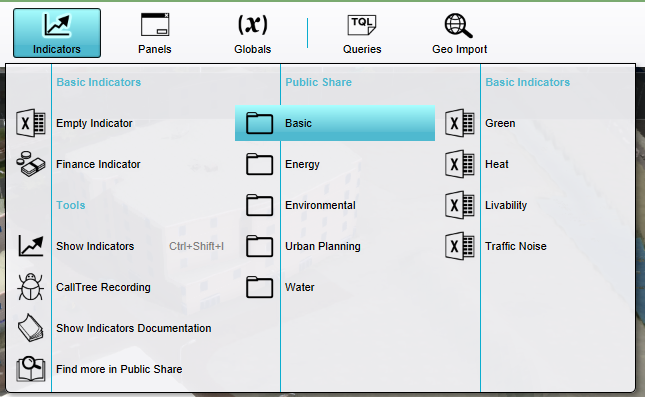 The default indicators shown in the indicators tab in the editor.
 -
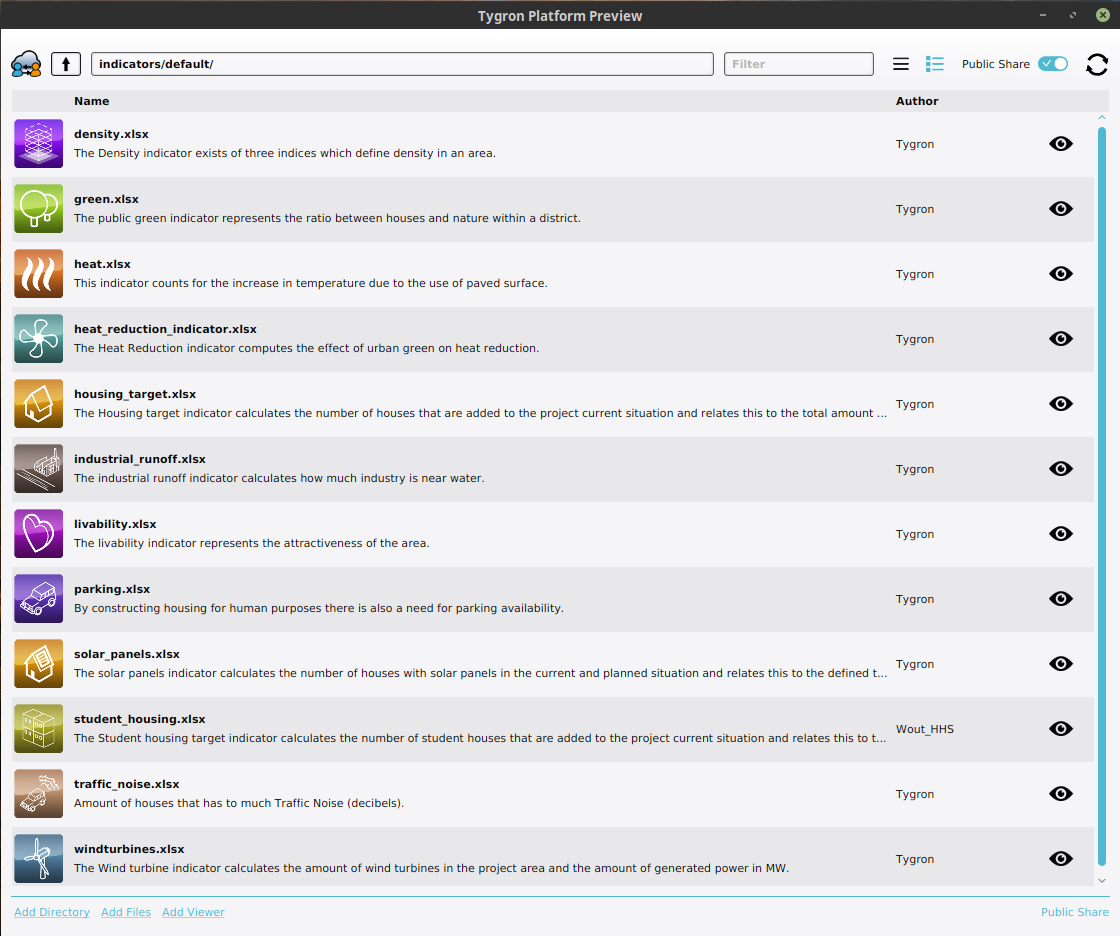 The indicators shown in the public GeoShare.


The available default indicators are listed below. Some of these indicators already perform specific calculations and can be directly used in the project. They can also be modified and extended with adjusted calculations.
It is also possible to implement your own indicator, using an Excel file. This Excel file should be imported into your project and assigned to an indicator. Each added indicator is initially empty, and will require some work to set up, but it is highly customizable.
Relation to stakeholders
By default, when adding an indicator, it is visible to and accessible by all stakeholders, through an icon in the top bar. Access to an indicator can be restricted when it is made personal; a link to a stakeholder can be configured for an indicator. This stakeholder is then considered the owner of the indicator.
For more information on adding and removing indicators to stakeholders, see stakeholders.
This relationship between an indicator and its personal stakeholder can be queried using TQL with the Relation parameter:
- Stakeholder name:
SELECT_NAME_WHERE_INDICATOR_IS_17_AND_RELATION_IS_OWNER - Stakeholder id:
SELECT_ID_WHERE_INDICATOR_IS_17_AND_RELATION_IS_OWNER
When using an excel for an Excel Indicator, you can also access the stakeholder directly using:
- Stakeholder name:
SELECT_NAME_WHERE_STAKEHOLDER_IS_ID - Stakeholder id:
SELECT_ID_WHERE_STAKEHOLDER_IS_ID

Excel Summary
- Below is a small summary describing a suggested workflow from a bird's eye perspective, without going deeper into details:
- Load a sample project in the editor.
- Create an empty xlsx workbook.
- Name one cell
EXPLANATION. - Create the
EXPLANATIONoutput format (HTML text string, HTML table) with%svariables. - Decide, based on the
EXPLANATION, which function categories are needed, and place them in one column. - Add consecutive columns that match the
EXPLANATION. - Create the
VARcolumns withROUND(UP)formulas andVAR_nname labels. - Create the
SCOREfield(s) as required by the type of project (Timeline/ Planning). - Optionally, test the spreadsheet by entering round values in query fields.
- Create a new Excel Indicator in the project and upload the Excel file to the project.
- Recalculate the indicators and verify if no errors are present.
Tips
- Divisions by zero can be solved as follows:
=C2/IF(D2,D2,1). In this example cells C2 and D2 contain number values. - Instead of using the VAR_# method for the explanation text, you can also use the concatenate function of excel:
CONCATENATE("<p>",A2, ": ", E2, " m2 and in Safe Zone: ", F2, " m2</p>")
- Starting with creating a table aids in setting up the Excel spreadsheet, by already thinking in advance about the lay out and formatting of the
EXPLANATION. - To quickly test the spreadsheet, without uploading it to the project, it is possible to enter some values in all the cells that contain queries as name. Other cells with formulas will change their content accordingly. By entering round values, for example 100, 1000, etc, calculations can easily be verified. Don't forget to save first and to revert back to the last saved version when done verifying!
- To display an actual percentage sign in the explanation, you need to place two percentage signs. I.e. : "50% of houses" should be written as "50%% of houses".
How-to's
- How to upload an Indicator Excel
- How to edit Excel named Cells
- How to add or remove or duplicate an Indicator
- How to edit Indicator properties
- How to edit Indicator targets
- How to configure a Query for an Excel Indicator
- How to make the Green Garden Indicator
- How to manually adjust Indicators in Excel
- How to use the Query Tool to test queries from an Excel Indicator spreadsheet
- How to change Function Values for a Function, to adjust the effects actions have on Indicators.
- How to make an Indicator visible to only one stakeholder
Videos
See also
API Endpoints
External links
 Current Situation
- Buildings • Terrains • Administrative • Areas • Networks • Overlays • Indicators • Panels • Globals • Queries • Geo Import
- Buildings
- Function • Function Override • Section • Category • Custom Geometry • Category Value • Function Value • Function Values Table • List of Functions
- Traffic
- Unit Type • Unit Data • Unit Data Override
- Terrain
- Height sector • Elevation model • Elevation GeoTIFF • Elevation Grid Overlay • Ground Price • Terrain Type • Terrain Type Override • List of Terrain Types
- Administrative
- Neighborhood • Zone • Permission Popup • Plot • Zip Code
- Queries
- Net Cluster • Net Function • Net Line • Net Load • Net Node • Net Setting
- Editor