|
|
| (93 intermediate revisions by 5 users not shown) |
| Line 1: |
Line 1: |
| [[File:Tql_webinar.png|link=https://www.tygron.com/nl/2019/05/22/tql-en-upgrades/]] [[File:Indicators.jpg|link=https://youtu.be/9lXiqef12aI|230px|]] | | [[File:Api_current_situation_calculation.png|thumb|right|400px|[[Overlay]] in comparison to [[Measurement]]s, [[Indicator]]s and [[Global]]s]] |
| | Indicators are named after Key Performance Indicators, which serve as a means to identify potential improvements and as a metric for the degree to which those improvements have been successful. |
|
| |
|
| ==Indicators==
| | Indicators are visible at the top of the [[interface]]. Each indicator is represented by a short name, and (with exception of the budget) is accompanied by a small progress bar to indicate how well you are performing on that indicator. Indicators can also be inspected by clicking on its element in the top bar, which opens the [[indicator panel]]. |
|
| |
|
| Indicators are the themes for which targets exist in a [[3D World]]. They are named after Key Performance Indicators, by which organizations evaluate their success. Key Performance Indicators serve as a means to identify potential improvements, and as a metric for the degree to which those improvements have been successful.
| | The progress made on an indicator depends on the ''absolute score'' setting of the indicator: |
| | * When selected, the progress is based on the absolute score. |
| | * When not selected, the progress is relative to the calculate score in the current situation. Such an indicator will measure the relative improvements. |
|
| |
|
| ==How indicators relate to the {{software}}==
| | In the indicator panel, the indicator's full name is shown in the title, along with a description and indicator progress on the left. On the right part of this panel a calculated score and an ''explanation'' are shown. The score and ''explanation'' are produced by the indicator's [[Excel Sheet]]. Basically, this excel sheet should be able to calculate a score and an ''explanation'' and place this in designated excel sheet cells. The excel sheet is also able to obtain information from a project using [[TQL|Tygron Query Language (TQL)]] statements. For more in depth information on indicator excel sheets, see [[Excel]] and [[Excel indicator]]. |
| Indicators are a primary part of your project, and serve as the guiding element by which [[Player|users]] can determine whether they are making progress. Just like Key Performance Indicators, indicators in the {{software}} serve as a means to identify how to improve the situation for your [[stakeholders|stakeholder]], and to what degree those improvements are affected by specific [[actions]]. By having the right indicators in a project, users are encouraged to take actions which would match the actions of the stakeholder in real life, and to quickly recognize the effects actions have on their own goals and the goals of other stakeholders.
| |
|
| |
|
| ==Indicators in the {{software}}==
| | [[File:Interface_game_indicator_panel.jpg|250px|left|thumb|The [[indicator panel]]. The left side displays the name, importance, and description of the indicator, as well as a graph showing its progress over time. The right side displays more information on the current situation and how to improve it.]] |
| Indicators are visible at the top of the [[interface]]. Each indicator is represented by a short name, and (with exception of the budget) is accompanied by a small progress bar to indicate how well you are performing on that indicator.
| |
|
| |
|
| Each indicator has a name, a description, a color and a target. The target is the most important part of the indicator, because that is what drives a stakeholder to perform (or abstain from) an action. Each action a stakeholder takes is meant to advance their indicators.
| | [[File:Interface_indicator_panel_green.jpg|250px|thumb|center|The [[indicator panel]] of a green indicator from the [[GeoShare]]. For this indicator, the score graph is turned off. The indicator only calculates a score for [[Neighborhoods]] that are active.]] |
| | {{clear}} |
| | ==Influencing Indicators== |
| | During a session, users' actions can influence Indicators, directly by spatial adjustments and [[TQL|spatial TQL statements]] and indirectly through [[Grid Overlay]] results and subsequent [[TQL|Grid TQL statements]]. It is up to the users to adjust their actions to improve the score on their Indicators. Also note that an action can also have effects on personal indicators of other stakeholders. For example, if a project developer creates a large office park where there previously was a forest, the amount of green will go down, which will negatively affect the goals of a municipality. |
|
| |
|
| ==Indicators and their relation to stakeholders==
| | [[File:Improving_green_indicator.jpg|thumb|left|250px|Improving the green indicator by planning a forest of deciduous trees. The improvement is shown in green in the [[Action log panel]].]] |
| | {{clear}} |
| | The current situation (original) and maquette (planned) situation can be compared by switching between these situations using the buttons in the [[top bar]]. |
| | [[File:Current_situation_green_indicator.jpg|thumb|left|250px|Current situation of the green indicator when planning a forest of deciduous trees. Notice the selected ''original'' button in the [[top bar]].]] |
| | [[File:Maquette_situation_green_indicator.jpg|thumb|center|250px|Maquette situation of the green indicator when planning a forest of deciduous trees. Notice the selected ''planned'' button in the [[top bar]].]] |
| | {{clear}} |
|
| |
|
| It is not necessarily so that each [[Stakeholders|Stakeholder]] has access to each indicator. Indicators which are not relevant to a stakeholder should not be displayed. For example, a project developer has very specific business driven goals, which differ from (or even conflict with) the goals of a municipality. The indicators can be adjusted for every stakeholder individually and for the common goals the targets and weight of the indicator differ. So it is possible that two stakeholders have the same goal, green for example and in this case, for the municipality it is more important to take action on implementing green than it is for the project developer. The difference in weight of the indicators can be adjusted in the [[Indicator Weights|indicator weights]]. | | ==Indicators on the GeoShare== |
| | You can also import indicators from the {{geoshare}}. There is a set of indicators made available in the {{Public Share}}. It is also possible to import indicators from {{geoshare}} of your [[domain]]. All indicators from the default public share have a page on the wiki with an additional explanation, which indicates if you need to add or edit something to your project when you import that indicator. For Example, some indicators make use of multiple [[Global]]s, an [[Overlay]] or [[Area]]s that needs to be implemented in order for the indicator to work. |
| | <gallery heights=300px widths=300px> |
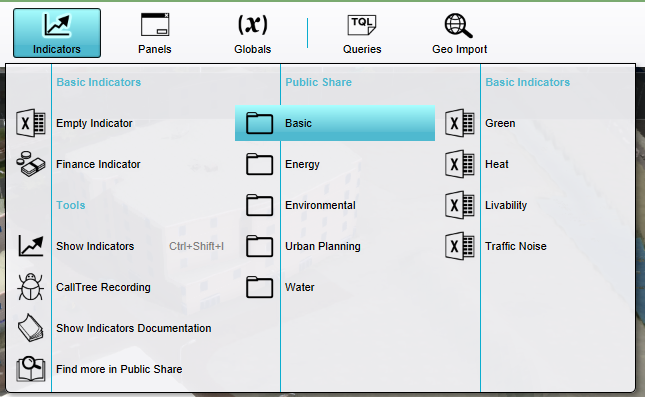
| | File:Share_public_indicators_editor.png|The default indicators shown in the indicators tab in the editor. |
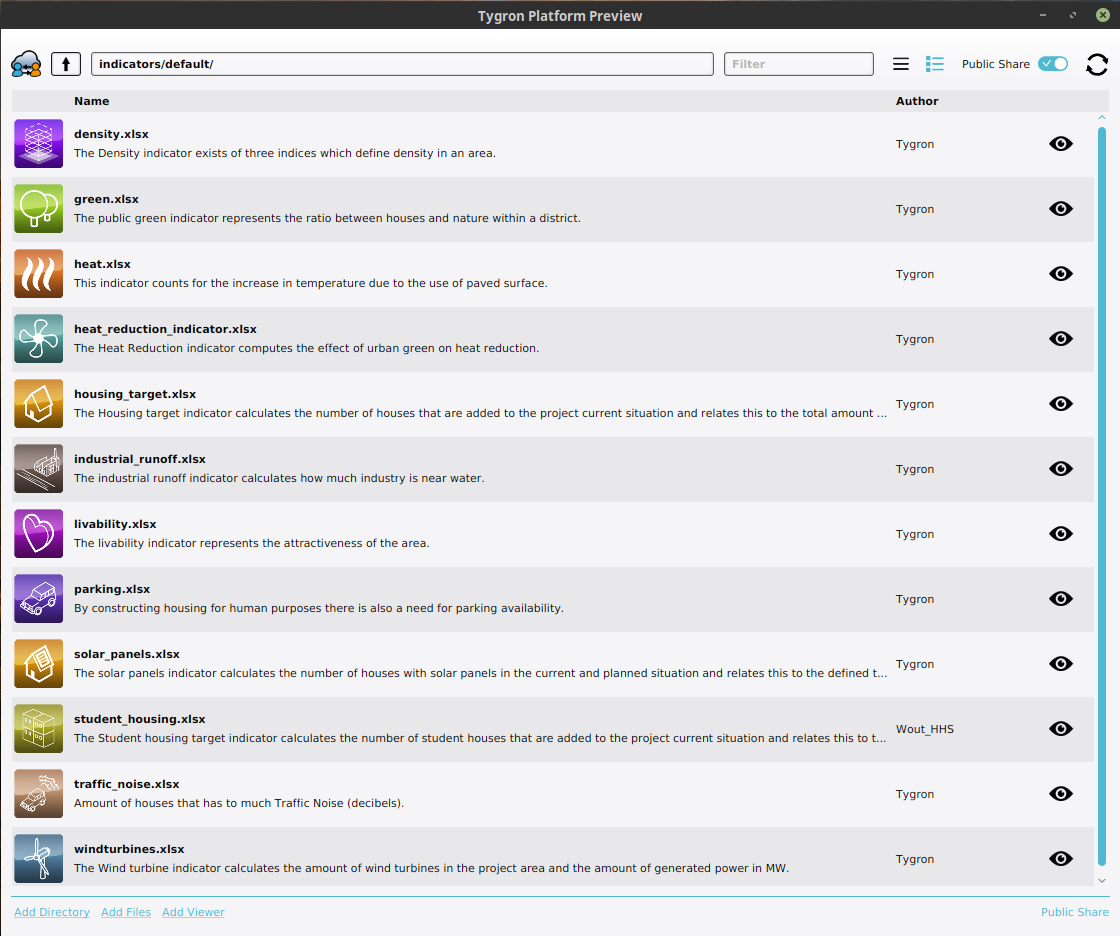
| | File:Share_public_indicators.png|The indicators shown in the public {{geoshare}}. |
| | </gallery> |
|
| |
|
| For more information on adding and removing indicators to stakeholders, see [[stakeholders]].
| | The available default indicators are listed below. |
| | Some of these indicators already perform specific calculations and can be directly used in the project. They can also be [[Excel indicator|modified and extended with adjusted calculation]]s. |
|
| |
|
| [[File:Topbar_Indicators.png|framed|left|The top bar of the interface. The indicators that are implemented in this example are Budget, Green and Building.]] | | It is also possible to implement your own indicator, using an [[Excel|Excel file]]. This Excel file should be imported into your project and assigned to an indicator. Each added indicator is initially empty, and will require some work to set up, but it is highly customizable. |
| <br clear=all>
| |
|
| |
|
| ===Indicator types=== | | ==Relation to stakeholders== |
| | By default, when adding an indicator, it is visible to and accessible by all stakeholders, through an icon in the [[top bar]]. Access to an indicator can be restricted when it is made personal; a link to a stakeholder can be configured for an indicator. This stakeholder is then considered the owner of the indicator. |
|
| |
|
| A number of indicators are available in the {{software}}. The available indicators are listed below.
| | For more information on adding and removing indicators to stakeholders, see [[stakeholders]]. |
| Some of these indicators already perform specific calculations and can be directly used in the project, but they also can be modified and extended with customized calculations. It is also possible to implement your own indicators with your own defined calculations. This can be done for the [[Excel_(Indicator)|Excel indicator]]. Because the [[Excel_(Indicator)|Excel indicator]] is initially empty, it requires more work to set up, but also allows for more flexibility through customization.
| |
| | |
| ====Stakeholder specific indicators====
| |
| This is an indicator that is specifically linked to a certain stakeholder. When you add this indicator it will only be visible for the stakeholder you add it to. For Example the Budget indicator only shows the budget amount for the specific stakeholder and it's target. After all, the budget of a stakeholder can differ and is a personal goal.
| |
| | |
| ======''Budget''======
| |
| : '' Main article: [[Budget (Indicator)]].''
| |
| :
| |
| : ''The amount of money available to a stakeholder. Most actions in the {{software}} require money by default. Actions which require spending more money than the stakeholder has available are sometimes allowed. However, should the stakeholder end up with a negative budget, their final score will be zero until their budget turns positive.''
| |
| | |
| ======''Building''======
| |
| : '' Main article: [[Building (Indicator)]].''
| |
| :
| |
| : ''The amount of constructions that a stakeholder wishes to reach. The targets for this indicator are subdivided into different types of constructions, such as luxury housing, offices, green and leisure. This indicator is unique in that a stakeholder will be penalized for exceeding their goal. Constructions are measured in units or by floor space.''
| |
| | |
| ====''Progress Indicator''====
| |
| :''Lastly, each stakeholder also has a [[Progress (Indicator)|Progress Indicator]] when you are in a [[Project_Session|Project session]]. This Indicator cannot be altered directly. It sums up the scores achieved on the other Indicators, based on their [[Indicator Weights|Indicator Weight]]. The Progress Indicator is a stakeholders total score.''
| |
| | |
| ====Shared indicators====
| |
| This is an indicator that is available for multiple stakeholders. When you add this indicator it will be visible for all stakeholders unless you remove it from a specific stakeholder. For Example the Green indicator shows the amount of green in the entire project area and is the same amount for all stakeholders. The weight and the target of the indicator can differ per stakeholder and that is how you can indicate the difference of this goal per stakeholder.
| |
| | |
| =====''Green''=====
| |
| : '' Main article: [[Green (Indicator)]].''
| |
| :
| |
| : ''Green is the amount of green in an area. More trees and open (grassland) areas increase the score for green. Buildings and concrete decrease the score for green.''
| |
| =====''Heat Stress''=====
| |
| : '' Main article: [[Heat (Indicator)]].''
| |
| :
| |
| : ''Heat stress is the amount of green and water in an area versus the paved surfaces. More trees and open water areas increase the score for Heat stress. Buildings and concrete decrease the score for Heat stress.''
| |
| | |
| =====''Parking''=====
| |
| : '' Main article: [[Parking (Indicator)]].''
| |
| :
| |
| : ''Parking is the amount of parking spaces in an area. Many buildings have an associated need for parking spaces nearby. By building parking facilities, the score on the Parking Indicator can be increased.''
| |
| | |
| =====''Livability''=====
| |
| : '' Main article: [[Livability (Indicator)]].''
| |
| :
| |
| : ''Livability is the extent to which an area is pleasant to live in. More open spaces, luxury buildings and green increase livability. Densification, poor quality buildings and lack of nature decrease Livability.''
| |
| | |
| =====''Water Storage''=====
| |
| : '' Main article: [[Water Storage (Indicator)]].''
| |
| :
| |
| : ''The amount of water storage capacity in an area. A greater capacity for storing water means an area becomes more resilient when faced with rain. Areas of open water, water-permeable surfaces and other means of storage increase the score for Water Storage.''
| |
| | |
| =====''Traffic NO2''=====
| |
| : '' Main article: [[Traffic NO2 (Indicator)]].''
| |
| :
| |
| : ''The number of buildings that has trouble with a too high concentration of NO2 due to the traffic in that particular area.''
| |
| | |
| =====''Traffic Noise''=====
| |
| : '' Main article: [[Traffic Noise (Indicator)]].''
| |
| :
| |
| : ''The number of buildings that has trouble with too much noise (decibel) due to the traffic in that particular area.''
| |
| | |
| =====''Excel Indicator''=====
| |
| : '' Main article: [[Excel (Indicator)|Excel (Indicator)]].''
| |
| :
| |
| : ''This is an indicator which calculates a score and explanation using a Microsoft Excel file. This file can be written locally and uploaded to the {{software}}. In order to obtain information from a running session on the {{software}}, a [[TQL | query language]] has been developed. By using the [https://support.office.com/en-sg/article/Define-and-use-names-in-formulas-2d9abce7-42cf-4a21-a6b4-f02786f690b7 'named cell'] functionality of Microsoft Excel, information can be sent back and forth to the {{software}}.''
| |
| | |
| ====Index indicators====
| |
| You can also get indicators in the [https://store.tygron.com/ Tygron Index]. Here you can download indicators that are created by serveral Tygron Platform users and/or upload your own indicators. For the up to date overview of available indicators on our Index please check the [https://store.tygron.com/ Index page] or enter the Index from the [[Community| Community hub]] in your project. A brief overview of indicators in the Index is given below.
| |
| All indicators on the Index have a page with an additional explanation on the wiki which indicates if you need to add or edit something to your project when you download and use the new indicator. For Example some indicators make use of a [[Globals|global]], an [[Overlay|overlay]] or an [[Areas|area]] that needs to be implemented in order for the indicator to work.
| |
| <br>
| |
| | |
| [[File:Index_in_indicatorpanel.png|300px|The Index in the indicatorpanel.]]
| |
| [[File:Community_hub.png|350px||The Index in the Community hub.]]
| |
| | |
| <br clear=all>
| |
| | |
| ===Influencing Indicators===
| |
| | |
| During a session, users are able to influence Indicators by taking actions. Almost every action has an effect on at least one Indicator. It is up to the users to apply their actions appropriately to increase the score on their Indicators. It is important to note that the effects of an action may extend to Indicators which are not relevant to the acting stakeholder. For example, if a project developer creates a large office park where there previously was a forest, the amount of green will go down, which will negatively affect the goals of a municipality.
| |
| | |
| ===Indicator targets===
| |
| The most important aspect of an Indicator is its target. By working towards reaching the target of an Indicator, a stakeholder can increase the total team score. Reaching their Indicator targets is the reason stakeholders perform actions. When a stakeholder has reached the target for a specific Indicator, they no longer need to perform actions for that specific target. Most projects have a balance wherein it is difficult, but not impossible, to reach the targets for all Indicators. Together with the [[Indicator Weights|Indicator weight]] and a stakeholder's [[stakeholder#Assignment_for_this_level|assignment]], they form a stakeholders [[objective]].
| |
| | |
| ==Editing Indicators==
| |
| | |
| In the editor, you can add, remove and change Indicators as desired.
| |
| | |
| ===Adding/removing Indicators===
| |
| | |
| {{Editor location|Indicators}}
| |
| | |
| [[File:Left_panel_indicator.png|framed|left|The left panel for Indicators in the editor.]]
| |
| | |
| Adding an indicator means making an Indicator available for use in the project. By default, an Indicator is automatically connected to the active stakeholder. This Indicator may still need to be connected to another stakeholder. It is important to make sure the Indicators are added to the stakeholders for whom they are applicable. For more information about adding Indicators to stakeholders, please see [[stakeholders#Left_Panel:_Stakeholders: Levels_(Dynamic properties)|stakeholders]]. When a shared Indicator is removed, it is automatically removed from all stakeholders. When a stakeholder is removed, no Indicators are removed from the project.
| |
| | |
| | |
| | |
| Adding and removing Indicators can be done by following these steps:
| |
| | |
| {{Editor steps|title=add an Indicator to the project|Select the type of Indicator you wish to add.|If applicable, select the stakeholder for whom to add the stakeholder.|Select "Add".}}
| |
| | |
| {{Editor steps|title=remove an Indicator from the project|Select the Indicator you want to remove.|Select "Remove".}}
| |
| <br clear=all>
| |
| | |
| ===Changing Indicators===
| |
| {{Editor location|Indicators|Indicator}}
| |
| | |
| [[File:Right_indicator_panel.png|framed|left|The right panel for indicators in the editor.]]
| |
| | |
| <!--Changing Indicators can be done by following these steps:
| |
| | |
| {{Editor steps|title=change an Indicator|Select the Indicator you wish to edit from the list on the left|Change the [[#Name|full name]] of the Indicator by changing the text in the "Name" field as desired.|Change the [[#Short name|short name]] of the Indicator by changing the text in the "Short name" field as desired.|Change the [[#Color|color]] used to display the indicator by holding down the left mouse button over the "color" square.|When dealing with a stakeholder-specific indicator, change the [[#Stakeholder|stakeholder]] of the indicator by selecting a different stakeholder from the dropdown menu.|Change the [[#Description|description]] by changing the text in the "Description" field.|Change the [[#Target|target]] of the indicator by altering the values in the "Target" column of the "Target for current level" table.|If not already so, make sure the "[[#Active|Active]]" check box is checked.}}-->
| |
| ====Stakeholder====
| |
| [[File:Dropdown_stakeholder.png|frame|right|The dropdown menu for the stakeholder.]]
| |
| : ''The stakeholder of the Indicator. Stakeholder-specific Indicators have a connection with a single stakeholder. When editing a stakeholder-specific Indicator, you can change this by selecting a different stakeholder from the dropdown menu.''<br clear=right>
| |
| | |
| ====Name====
| |
| [[File:Name.png|frame|right|The field for the "name".]]
| |
| : ''The full name of the Indicator. This is the name that will appear as the title of the Indicator in the project. You can change this by altering the text in the "Name" field.''<br clear=right>
| |
| | |
| ====Short name====
| |
| [[File:Short_name.png|frame|right|The field for the "short name".]]
| |
| : ''The short name of the Indicator. This will appear in areas where multiple indicators are summed up. You can change this by altering the text in the "Short name" field.''<br clear=right>
| |
| | |
| ====Absolute score====
| |
| [[File:Absolute_score.png|frame|right|The checkbox for the "absolute score".]]
| |
| ''If the checkbox for absolute score is checked, the absolute score of the Indicator is used. The score is a value between 0 and 100%. What exactly 0% is, is adjustable with this checkbox. If the checkbox is not checked, 0% is the state of the current situation. The Indicator therefore always starts at 0. If you make changes to the current situation by demolishing or building [[Constructions|constructions]], a new score is calculated based on the impact of the changes to the current situation. If you use the absolute score, a score is already calculated for the current situation, therefore the Indicator can already have a value of for example 60%. By making changes to the current situation, the score changes. Here the 0% is thus defined by the formulas in the excelsheet of the Indicator.''
| |
| | |
| ====Graph====
| |
| [[File:Score_graph.png|frame|right|The checkbox to show the "score graph".]]
| |
| ''If the checkbox for show score graph is checked, the score graph is visible in the Indicator panel. This score graph is especially useful when playing a timeline game in where the graph shows how the score changes over time. If the checkbox is unchecked, the score graph is not visible. By leaving the text in the description box empty, the full space in the indicator panel can be used for example for showing the output of an [[Excel indicator]].''
| |
| | |
| ====Color====
| |
| [[File:Color.png|frame|right|The "color" square.]]
| |
| : ''The color of the indicator. The color will be used to display the indicator in graphs and charts. You can change this selecting the color field. A panel will appear in which you can specify the desired color.''<br clear=right>
| |
| | |
| ====Active====
| |
| [[File:Active_checkbox.png|frame|right|The "active" checkbox.]]
| |
| : ''Whether the Indicator is active. Inactive Indicators remain connected to stakeholders, but are unseen and have no effect. You will most likely want this checkbox checked. Toggle between the Indicator being active and inactive by clicking the check box.''<br clear=right>
| |
| | |
| ====Image====
| |
| [[File:Image.png|frame|right|The "image" selection field.]]
| |
| : ''The Indicator image, as displayed on the top bar, next to the Indicator progression bar. It is possible to upload a custom image to the {{software}}. This image has to be uploaded as a .png file, and has to be exactly 39 x 39 pixels small.''<br clear=right>
| |
| | |
| ====Excelsheet====
| |
| [[File:Excelsheet.png|frame|right|The "Excelsheet" field.]]
| |
| : ''The Excelsheet section showes which Excelsheet is active for the specific Indicator. The [[Excel_file_manager|Select Excelsheet]] button opens an overview panel of all the Excelsheets in the project. The [[Excel#Debugging|Debug Excelsheet]] and [[CallTree Recordings|CallTree Recordings]] can be used for debugging the Excelsheet. This is mostly done when an error messages appears about the Excelsheet. The Open in Web Browser link displays the target and score of the indicator in a seperate web page.''<br clear=right>
| |
|
| |
|
| ====Description====
| | This relationship between an indicator and its personal stakeholder can be queried using TQL with the [[Relation (TQL Param)|Relation parameter]]: |
| [[File:Description.png|frame|right|The text area for the "description".]] | | * Stakeholder name: <code>SELECT_NAME_WHERE_INDICATOR_IS_17_AND_RELATION_IS_OWNER</code> |
| : ''The description of the Indicator. Most Indicators have a default description, but by customizing this text it is possible to guide the users towards specific actions, provide hints or refer to other sources of information. You can change this by altering the text in the "Description" area.''<br clear=right> | | * Stakeholder id: <code>SELECT_ID_WHERE_INDICATOR_IS_17_AND_RELATION_IS_OWNER</code> |
|
| |
|
| ===Changing Indicator targets===
| | When using an excel for an Excel Indicator, you can also access the stakeholder directly using: |
| By setting the target for an Indicator, you are directly instructing the stakeholder what they should strive for in the project. Depending on the selected Indicator type, one or more values can be entered for targets. For example: for a budget Indicator, you only need to set the amount of money the stakeholder should have remaining. For the building Indicator, you can enter a separate target for each type of building. You can change the targets of an Indicator in the "Target for current level" table. In the "Description" column, you can see the description of which row represents which aspect of the target of an Indicator. You can enter a numeric target value in the "Target" column. This value must lie within the range indicated by the "Minimum" and "Maximum" columns.<br clear=all>
| | * Stakeholder name: <code>SELECT_NAME_WHERE_STAKEHOLDER_IS_ID</code> |
| [[File:Target_panel.png|frame|left|The "targets" table.]]
| | * Stakeholder id: <code>SELECT_ID_WHERE_STAKEHOLDER_IS_ID</code> |
| <br clear=all> | |
|
| |
|
| ===Changing the effect of actions on Indicators===
| | [[File:Personal_heat_indicator.png|thumb|right| A personal heat indicator for the municipality. It is only visible in the top bar for this specific stakeholder.]] |
| It is possible to adjust the effects actions have on Indicators. For more information on this, please see [[functions]]. | |
|
| |
|
| {{Template:Editor current situation nav}} | | {{article end |
| | |seealso= |
| | * [[Excel Indicator]] |
| | * [[TQL]] |
| | |howtos= |
| | * [[How to add, remove and duplicate an Indicator]] |
| | * [[How to edit Indicator properties]] |
| | * [[How to edit Indicator targets]] |
| | * [[How to configure a Query for an Excel Indicator]] |
| | * [[How to implement an Excel Indicator]] |
| | * [[How to make the Green Garden Indicator]] |
| | * [[How to manually adjust Indicators in Excel]] |
| | * [[How to use the Query Tool to test queries from an Excel Indicator spreadsheet]] |
| | * [[How to change Function Values for a Function]], to adjust the effects actions have on Indicators. |
| | * [[How to make an Indicator visible to only one stakeholder]] |
| | |videos= |
| | {{video|youtube=Vv1XA3HCOyQ&t=734s}} |
| | |external= |
| | * [https://www.youtube.com/watch?v=Vv1XA3HCOyQ&t=734s TQL and Indicators Webinar] |
| | }} |
|
| |
|
| [[Category:Items]] | | {{Editor current situation nav}} |
| | {{Indicator nav}} |
| | [[Category:Items]][[Category:Indicator]] |