Indicator: Difference between revisions
| (387 intermediate revisions by 18 users not shown) | |||
| Line 1: | Line 1: | ||
[[File:Api_current_situation_calculation.png|thumb|right|400px|[[Overlay]] in comparison to [[Measurement]]s, [[Indicator]]s and [[Global]]s]] | |||
Indicators are named after Key Performance Indicators, which serve as a means to identify potential improvements and as a metric for the degree to which those improvements have been successful. | |||
Indicators are visible at the top of the [[interface]]. Each indicator is represented by a short name, and (with exception of the budget) is accompanied by a small progress bar to indicate how well you are performing on that indicator. Indicators can also be inspected by clicking on its element in the top bar, which opens the [[indicator panel]]. | |||
The progress made on an indicator depends on the ''absolute score'' setting of the indicator: | |||
* When selected, the progress is based on the absolute score. | |||
* When not selected, the progress is relative to the calculate score in the current situation. Such an indicator will measure the relative improvements. | |||
In the indicator panel, the indicator's full name is shown in the title, along with a description and indicator progress on the left. On the right part of this panel a calculated score and an ''explanation'' are shown. The score and ''explanation'' are produced by the indicator's [[Excel Sheet]]. Basically, this excel sheet should be able to calculate a score and an ''explanation'' and place this in designated excel sheet cells. The excel sheet is also able to obtain information from a project using [[TQL|Tygron Query Language (TQL)]] statements. For more in depth information on indicator excel sheets, see [[Excel]] and [[Excel indicator]]. | |||
[[File:Interface_game_indicator_panel.jpg|250px|left|thumb|The [[indicator panel]]. The left side displays the name, importance, and description of the indicator, as well as a graph showing its progress over time. The right side displays more information on the current situation and how to improve it.]] | |||
[[File:Interface_indicator_panel_green.jpg|250px|thumb|center|The [[indicator panel]] of a green indicator from the [[GeoShare]]. For this indicator, the score graph is turned off. The indicator only calculates a score for [[Neighborhoods]] that are active.]] | |||
{{clear}} | |||
==Influencing Indicators== | |||
During a session, users' actions can influence Indicators, directly by spatial adjustments and [[TQL|spatial TQL statements]] and indirectly through [[Grid Overlay]] results and subsequent [[TQL|Grid TQL statements]]. It is up to the users to adjust their actions to improve the score on their Indicators. Also note that an action can also have effects on personal indicators of other stakeholders. For example, if a project developer creates a large office park where there previously was a forest, the amount of green will go down, which will negatively affect the goals of a municipality. | |||
[[File:Improving_green_indicator.jpg|thumb|left|250px|Improving the green indicator by planning a forest of deciduous trees. The improvement is shown in green in the [[Action log panel]].]] | |||
{{clear}} | |||
The current situation (original) and maquette (planned) situation can be compared by switching between these situations using the buttons in the [[top bar]]. | |||
[[File:Current_situation_green_indicator.jpg|thumb|left|250px|Current situation of the green indicator when planning a forest of deciduous trees. Notice the selected ''original'' button in the [[top bar]].]] | |||
[[File:Maquette_situation_green_indicator.jpg|thumb|center|250px|Maquette situation of the green indicator when planning a forest of deciduous trees. Notice the selected ''planned'' button in the [[top bar]].]] | |||
{{clear}} | |||
==Indicators on the GeoShare== | |||
You can also import indicators from the {{geoshare}}. There is a set of indicators made available in the {{Public Share}}. It is also possible to import indicators from {{geoshare}} of your [[domain]]. All indicators from the default public share have a page on the wiki with an additional explanation, which indicates if you need to add or edit something to your project when you import that indicator. For Example, some indicators make use of multiple [[Global]]s, an [[Overlay]] or [[Area]]s that needs to be implemented in order for the indicator to work. | |||
<gallery heights=300px widths=300px> | |||
File:Share_public_indicators_editor.png|The default indicators shown in the indicators tab in the editor. | |||
File:Share_public_indicators.png|The indicators shown in the public {{geoshare}}. | |||
</gallery> | |||
The available default indicators are listed below. | |||
Some of these indicators already perform specific calculations and can be directly used in the project. They can also be [[Excel indicator|modified and extended with adjusted calculation]]s. | |||
It is also possible to implement your own indicator, using an [[Excel|Excel file]]. This Excel file should be imported into your project and assigned to an indicator. Each added indicator is initially empty, and will require some work to set up, but it is highly customizable. | |||
==Relation to stakeholders== | |||
By default, when adding an indicator, it is visible to and accessible by all stakeholders, through an icon in the [[top bar]]. Access to an indicator can be restricted when it is made personal; a link to a stakeholder can be configured for an indicator. This stakeholder is then considered the owner of the indicator. | |||
For more information on adding and removing indicators to stakeholders, see [[stakeholders]]. | |||
This relationship between an indicator and its personal stakeholder can be queried using TQL with the [[Relation (TQL Param)|Relation parameter]]: | |||
* Stakeholder name: <code>SELECT_NAME_WHERE_INDICATOR_IS_17_AND_RELATION_IS_OWNER</code> | |||
* Stakeholder id: <code>SELECT_ID_WHERE_INDICATOR_IS_17_AND_RELATION_IS_OWNER</code> | |||
When using an excel for an Excel Indicator, you can also access the stakeholder directly using: | |||
* Stakeholder name: <code>SELECT_NAME_WHERE_STAKEHOLDER_IS_ID</code> | |||
* Stakeholder id: <code>SELECT_ID_WHERE_STAKEHOLDER_IS_ID</code> | |||
[[File:Personal_heat_indicator.png|thumb|right| A personal heat indicator for the municipality. It is only visible in the top bar for this specific stakeholder.]] | |||
& | {{article end | ||
& | |seealso= | ||
* [[Excel Indicator]] | |||
* [[TQL]] | |||
|howtos= | |||
* [[How to add, remove and duplicate an Indicator]] | |||
* [[How to edit Indicator properties]] | |||
* [[How to edit Indicator targets]] | |||
* [[How to configure a Query for an Excel Indicator]] | |||
* [[How to implement an Excel Indicator]] | |||
* [[How to make the Green Garden Indicator]] | |||
* [[How to manually adjust Indicators in Excel]] | |||
* [[How to use the Query Tool to test queries from an Excel Indicator spreadsheet]] | |||
* [[How to change Function Values for a Function]], to adjust the effects actions have on Indicators. | |||
* [[How to make an Indicator visible to only one stakeholder]] | |||
|videos= | |||
{{video|youtube=Vv1XA3HCOyQ&t=734s}} | |||
|external= | |||
* [https://www.youtube.com/watch?v=Vv1XA3HCOyQ&t=734s TQL and Indicators Webinar] | |||
}} | |||
[[ | {{Editor current situation nav}} | ||
{{Indicator nav}} | |||
[[Category:Items]][[Category:Indicator]] | |||
: | |||
Latest revision as of 09:19, 12 February 2024

Indicators are named after Key Performance Indicators, which serve as a means to identify potential improvements and as a metric for the degree to which those improvements have been successful.
Indicators are visible at the top of the interface. Each indicator is represented by a short name, and (with exception of the budget) is accompanied by a small progress bar to indicate how well you are performing on that indicator. Indicators can also be inspected by clicking on its element in the top bar, which opens the indicator panel.
The progress made on an indicator depends on the absolute score setting of the indicator:
- When selected, the progress is based on the absolute score.
- When not selected, the progress is relative to the calculate score in the current situation. Such an indicator will measure the relative improvements.
In the indicator panel, the indicator's full name is shown in the title, along with a description and indicator progress on the left. On the right part of this panel a calculated score and an explanation are shown. The score and explanation are produced by the indicator's Excel Sheet. Basically, this excel sheet should be able to calculate a score and an explanation and place this in designated excel sheet cells. The excel sheet is also able to obtain information from a project using Tygron Query Language (TQL) statements. For more in depth information on indicator excel sheets, see Excel and Excel indicator.


Influencing Indicators
During a session, users' actions can influence Indicators, directly by spatial adjustments and spatial TQL statements and indirectly through Grid Overlay results and subsequent Grid TQL statements. It is up to the users to adjust their actions to improve the score on their Indicators. Also note that an action can also have effects on personal indicators of other stakeholders. For example, if a project developer creates a large office park where there previously was a forest, the amount of green will go down, which will negatively affect the goals of a municipality.

The current situation (original) and maquette (planned) situation can be compared by switching between these situations using the buttons in the top bar.


You can also import indicators from the GeoShare. There is a set of indicators made available in the Public Share. It is also possible to import indicators from GeoShare of your domain. All indicators from the default public share have a page on the wiki with an additional explanation, which indicates if you need to add or edit something to your project when you import that indicator. For Example, some indicators make use of multiple Globals, an Overlay or Areas that needs to be implemented in order for the indicator to work.
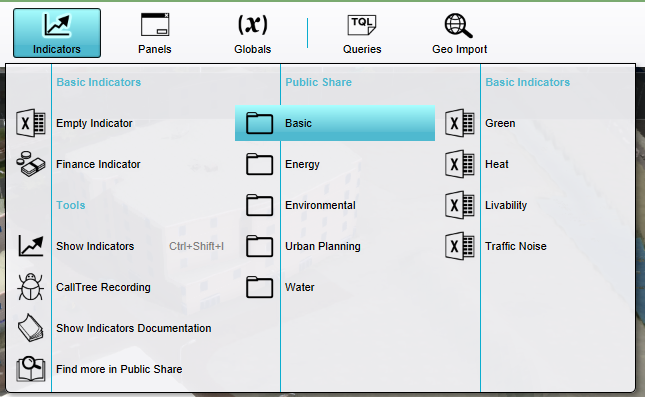
The default indicators shown in the indicators tab in the editor.
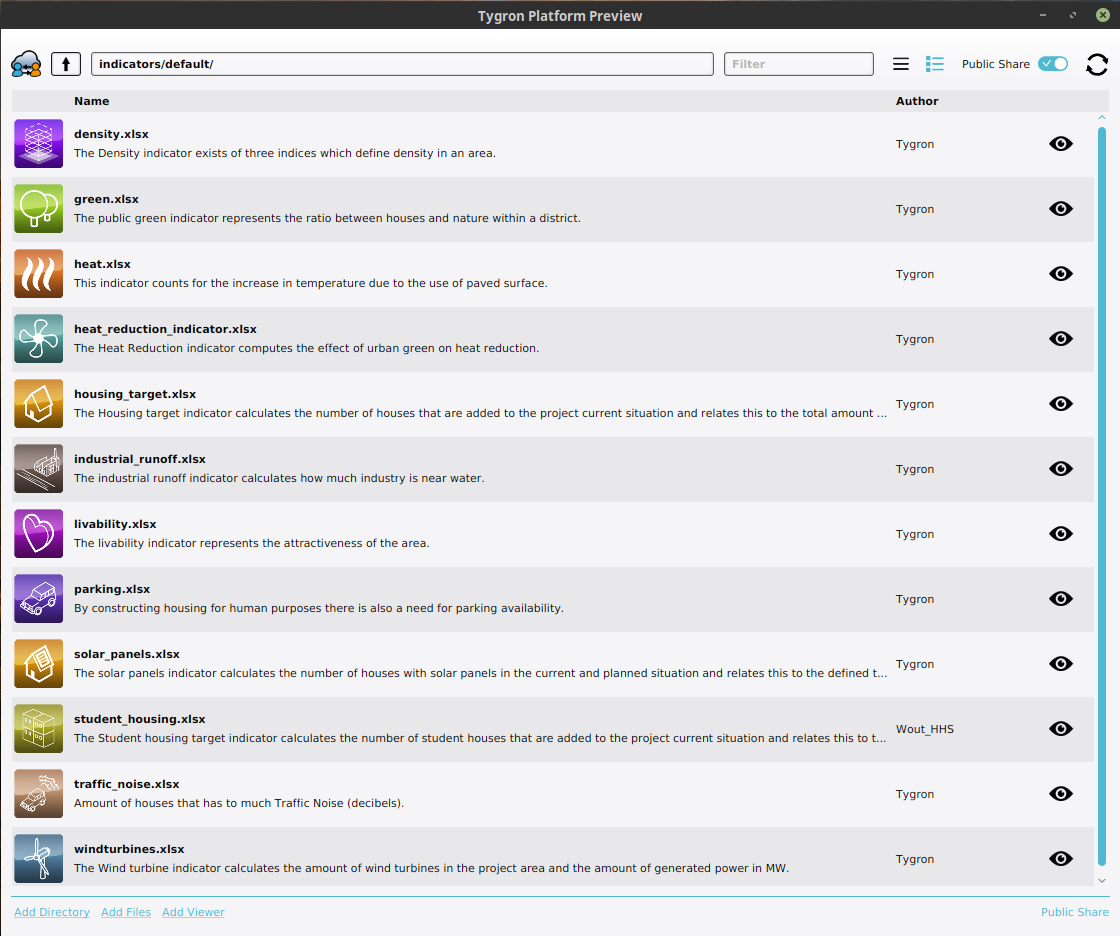
The indicators shown in the public GeoShare.


The available default indicators are listed below. Some of these indicators already perform specific calculations and can be directly used in the project. They can also be modified and extended with adjusted calculations.
It is also possible to implement your own indicator, using an Excel file. This Excel file should be imported into your project and assigned to an indicator. Each added indicator is initially empty, and will require some work to set up, but it is highly customizable.
Relation to stakeholders
By default, when adding an indicator, it is visible to and accessible by all stakeholders, through an icon in the top bar. Access to an indicator can be restricted when it is made personal; a link to a stakeholder can be configured for an indicator. This stakeholder is then considered the owner of the indicator.
For more information on adding and removing indicators to stakeholders, see stakeholders.
This relationship between an indicator and its personal stakeholder can be queried using TQL with the Relation parameter:
- Stakeholder name:
SELECT_NAME_WHERE_INDICATOR_IS_17_AND_RELATION_IS_OWNER - Stakeholder id:
SELECT_ID_WHERE_INDICATOR_IS_17_AND_RELATION_IS_OWNER
When using an excel for an Excel Indicator, you can also access the stakeholder directly using:
- Stakeholder name:
SELECT_NAME_WHERE_STAKEHOLDER_IS_ID - Stakeholder id:
SELECT_ID_WHERE_STAKEHOLDER_IS_ID

How-to's
- How to add, remove and duplicate an Indicator
- How to edit Indicator properties
- How to edit Indicator targets
- How to configure a Query for an Excel Indicator
- How to implement an Excel Indicator
- How to make the Green Garden Indicator
- How to manually adjust Indicators in Excel
- How to use the Query Tool to test queries from an Excel Indicator spreadsheet
- How to change Function Values for a Function, to adjust the effects actions have on Indicators.
- How to make an Indicator visible to only one stakeholder
Videos
See also
External links
- Buildings • Terrains • Administrative • Areas • Networks • Overlays • Indicators • Panels • Globals • Queries • Geo Import
- Buildings
- Function • Function Override • Traffic Units
- Terrain
- Height sector • Elevation model • Elevation GeoTIFF • Elevation Grid Overlay • Ground Price • Terrain Type • Terrain Type Override
- Administrative
- Net Cluster • Net Function • Net Line • Net Load • Net Node • Net Setting
- Editor