System visualization (Water Overlay)
When a Water Overlay is active, the water system and hydraulic constructions are schematically visualized to provide more insight. If water has flowed through any of the hydraulic constructions, animated arrows in the connecting lines will indicate that movement. Also, when zoomed in on the constructions, the Water level at either side of the construction is visible. Below an overview of the different components in the water system.
Water Objects
| Type | Image | Description |
|---|---|---|
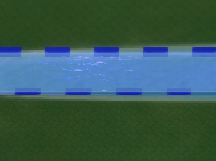
| Water area | Each Water area is visualized by a dashed border along the surface of the Terrain. | |
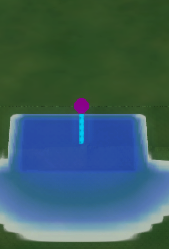
| Breach | A Breach area is visualized by a purple sphere. | |
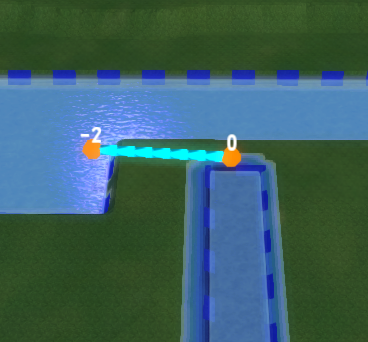
| Weir | Schematic visualization of a Weir. The water levels at either side and also the direction of the flow is visible. | |
| Culvert | Schematic visualization of a Culvert. The water levels at either side and also the direction of the flow is visible. | |
| Pump | Schematic visualization of a Pump. The water levels at either side and also the direction of the flow is visible. | |
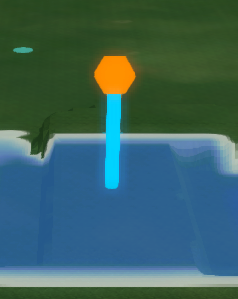
| In- or Outlet | Schematic visualization of an Inlet or Outlet. | |
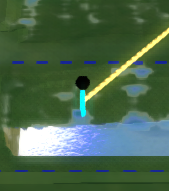
| Sewer overflow | The Sewer overflow is visualized with a black sphere. | |
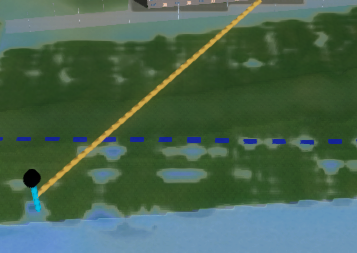
| Sewer area | The Sewer area is visualized with an orange line which connects the center of the area with the Sewer overflow. |
Water Area Visualization
Water Area Coloring
| Type | Image | Description |
|---|---|---|
| Water area connected and flowing out from | Each Water area|Water area connected to another area and water is flowing out. |
Visualization options
In step 4 Interaction of the Water Overlay Wizard different options for visualizing the water system can be selected. Notice that multiple options at once can be selected.
Display Water Objects
This mode is by default selected and will schematically visualize the water system and hydraulic constructions as seen above.
Display Water Area System
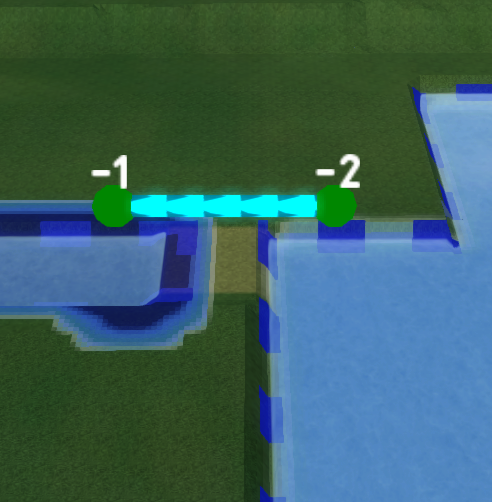
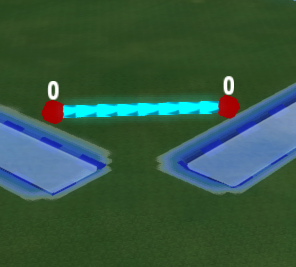
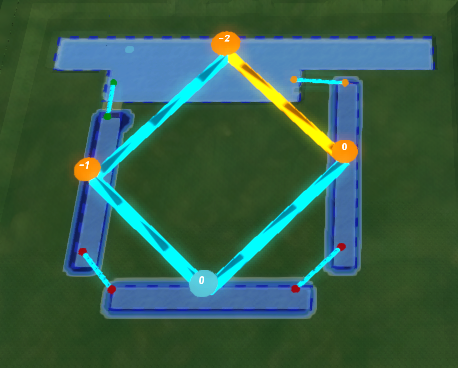
This option adds a schematic line visualization which is visible when zooming out. The direction, flow of the water and the water levels can be seen.
The dots indicate the center location of the water area. Its color indicate whether the water level has:
- risen; colored dark blue.
- lowered; colored orange.
- stayed roughly the same, colored cyan; The acceptable range is 0.1 meters compared to the original water level.
This mode is useful for debugging the water system.
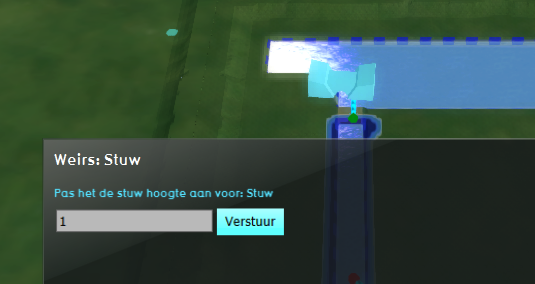
Display Weirs with Panels
When present, Weirs will be visualized with a Panel Popup. It is possible to click on this popup to open the Panel and change the Weir height. Note that a Test Run will start when changing this height. The panels are Template Excel panels which can be downloaded and adjusted as desired.
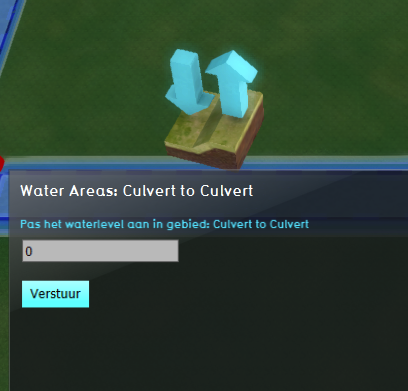
Display Water Areas with Panels
When present, Water areas will be highlighted with a Panel Popup. When clicking on this popup, the Panel opens and it is possible to change dynamically the Water level. Note that a Test Run will start when changing the Water level. The panels are Template Excel panels which can be downloaded and adjusted as desired.
