Season formula (Water Overlay): Difference between revisions
Jump to navigation
Jump to search
No edit summary |
No edit summary |
||
| Line 3: | Line 3: | ||
Evaporation month indices: | Evaporation month indices: | ||
{| class=wikitable | {| class=wikitable | ||
! Month | ! Month | ||
! Day of Month | ! Day of Month | ||
! Transpiration value | ! Transpiration value | ||
|- | |- | ||
| March | | March | ||
| 15 | | 15 | ||
| 1st | | 1st | ||
|- | |- | ||
| April | | April | ||
| 15 | | 15 | ||
| 2nd | | 2nd | ||
|- | |- | ||
| July | | July | ||
| 15 | | 15 | ||
| 3rth | | 3rth | ||
|- | |- | ||
| September | | September | ||
| 15 | | 15 | ||
| 4th | | 4th | ||
|- | |- | ||
| October | | October | ||
| 1 | | 1 | ||
Revision as of 11:03, 27 February 2024
The season fraction and index are variables used for calculating the transpiration factor in the Ground evaporation formula. It uses the configured start date of a Water Overlay and selected months and day of months to determine one of the four configured (seasonal) evaporation factors.
Evaporation month indices:
| Month | Day of Month | Transpiration value |
|---|---|---|
| March | 15 | 1st |
| April | 15 | 2nd |
| July | 15 | 3rth |
| September | 15 | 4th |
| October | 1 | 1st |
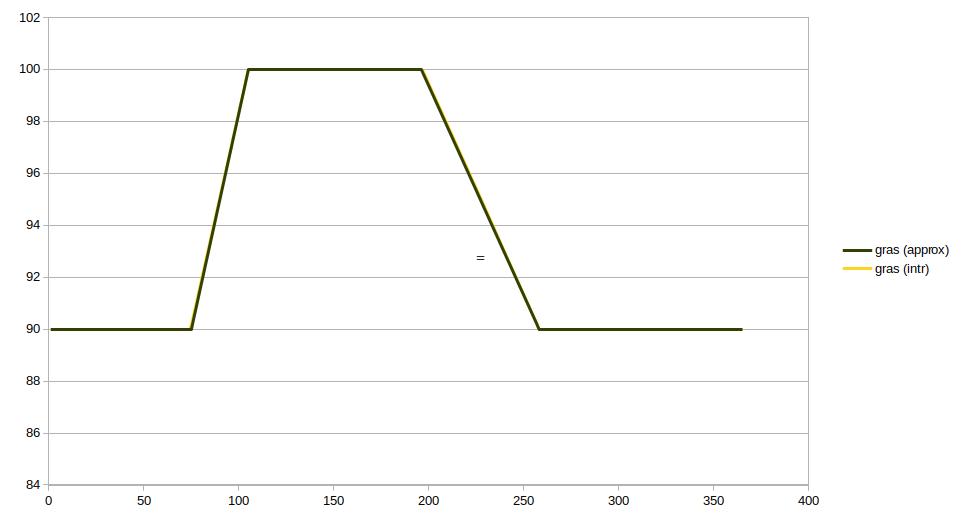
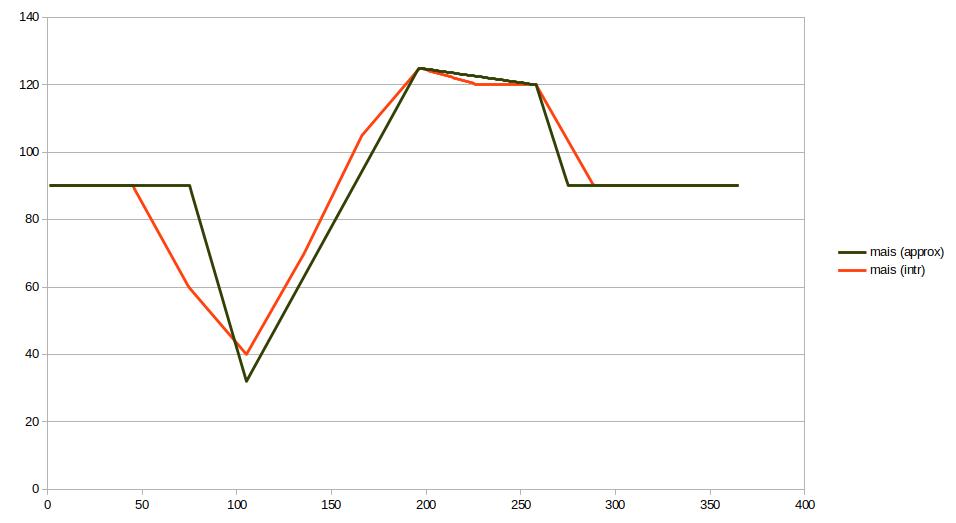
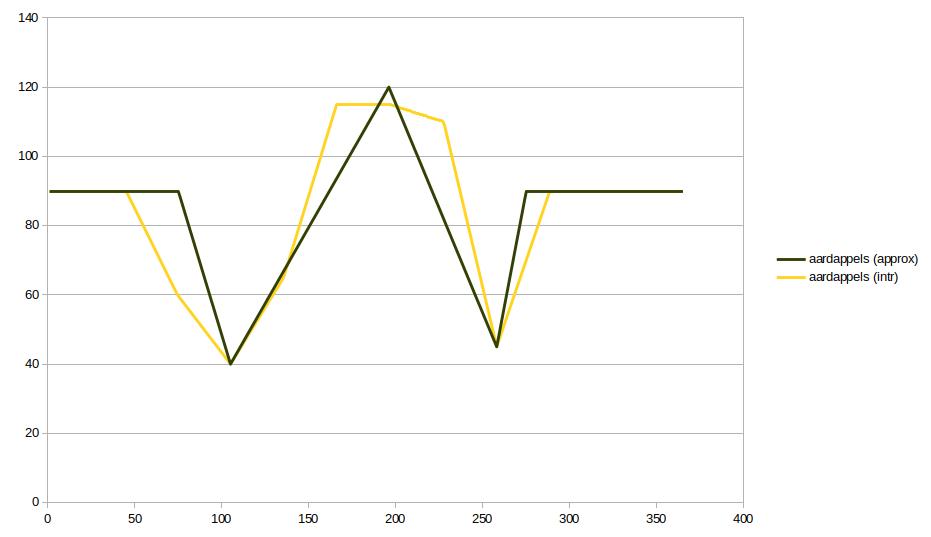
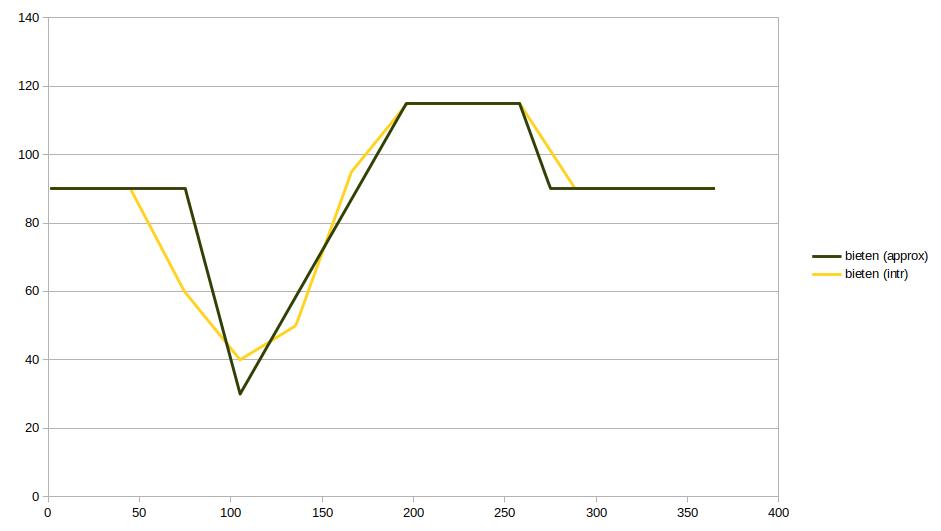
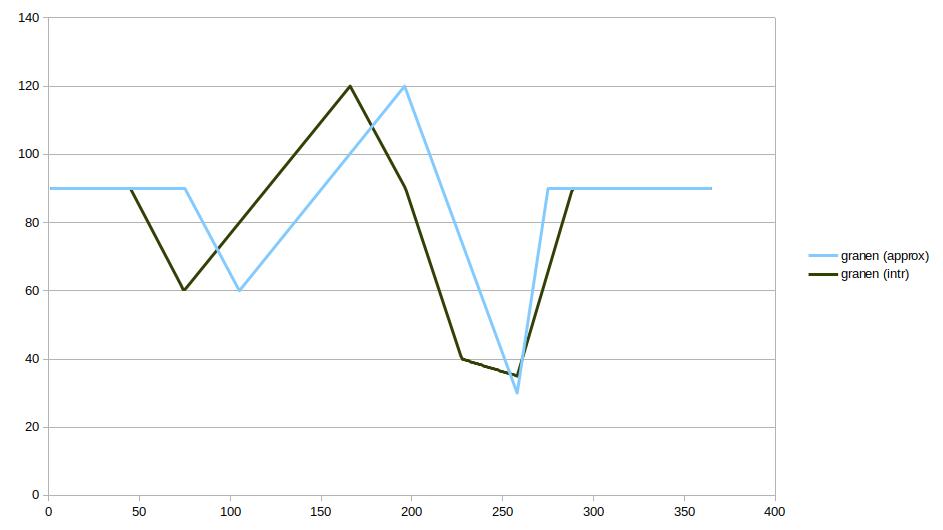
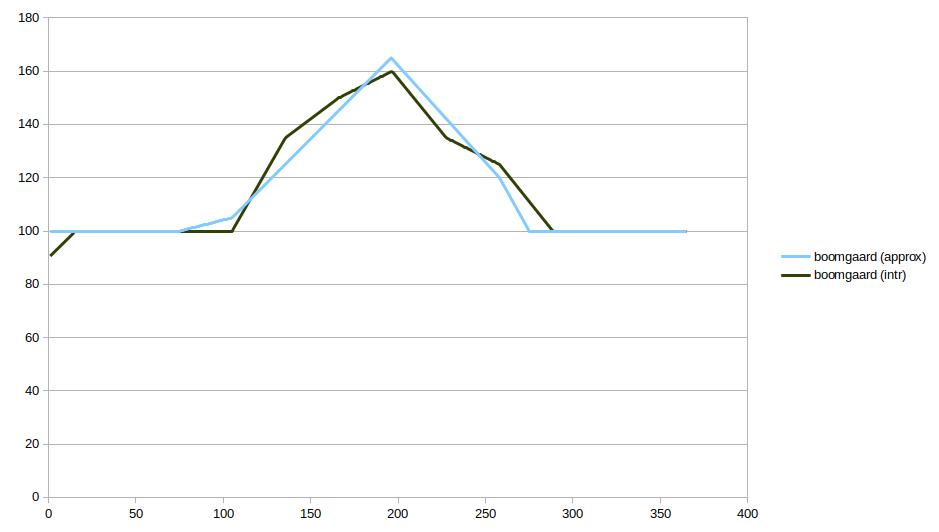
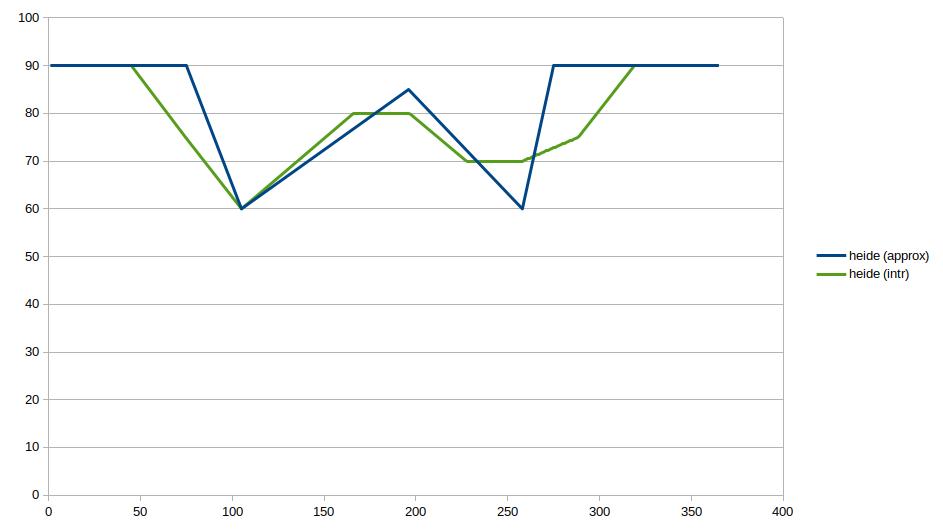
Evaporation factor graphs
The evaporation graphs showing the evaporation factor as a percentage per day. These are based on Table 2.10 Cropfactors[1] of the Gwz2016 book. The approximated graphs use five control points (see the season table above) per type, such that it can be reduced to four values per year.
Notes
- The growth season dates are determined based on western european growth and transpiration graphs of the following crops and plants: grass, corn, potato, beet, grain, orchard and heather.
See also
References
- ↑ Table 2.10 Gewasfactoren, % van referentiegewasverdamping van Makkink, Bram Bot (2016) ∙ Grondwaterzakboekje, Gwz2016 ∙ Impressed druk en print
