Heat Stress Overlay: Difference between revisions
Jump to navigation
Jump to search
mNo edit summary |
|||
| (105 intermediate revisions by 9 users not shown) | |||
| Line 1: | Line 1: | ||
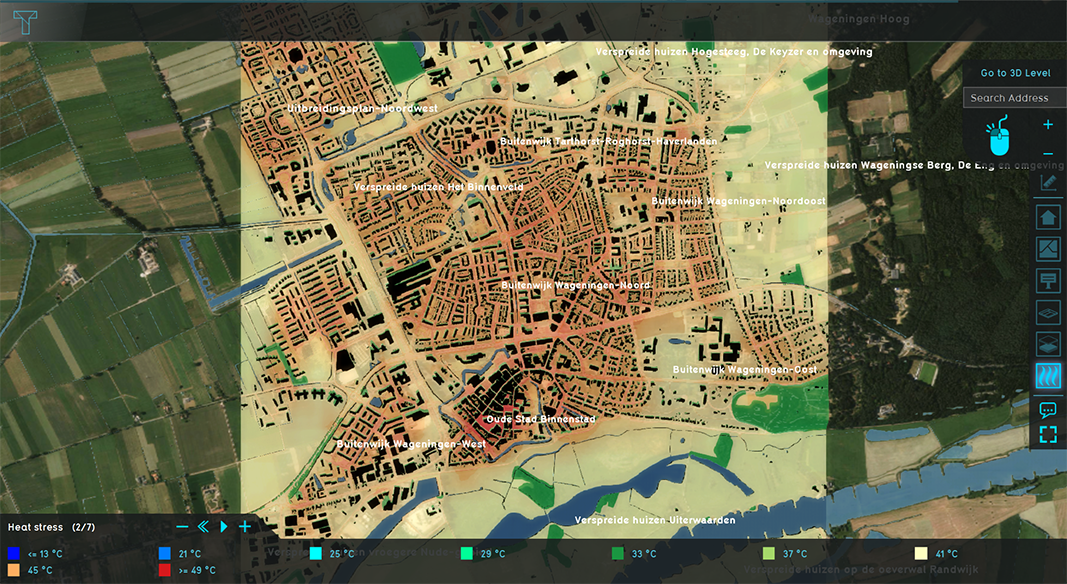
[[File:DPRA_Heatstress_overlay.PNG|thumb|420px|right|Example of the DPRA heat stress overlay]] | |||
The new Heat Stress [[Overlay]] module is in accordance with the 2019 {{Heat DPRA Report}}. | |||
==Modules== | |||
In order to configure a Heat Stress Overlay, a module has to be selected. The module can be configured by opening the Heat Overlay Wizard. | |||
The | The selectable modules are: | ||
* [[DPRA Heat Module|DPRA Heat stress module]]. This module is more detailed and based on the 2019 {{Heat DPRA Report}}. It can generate multiple Heat Overlay [[Result types (Heat Overlay)|result types]] as child overlays; | |||
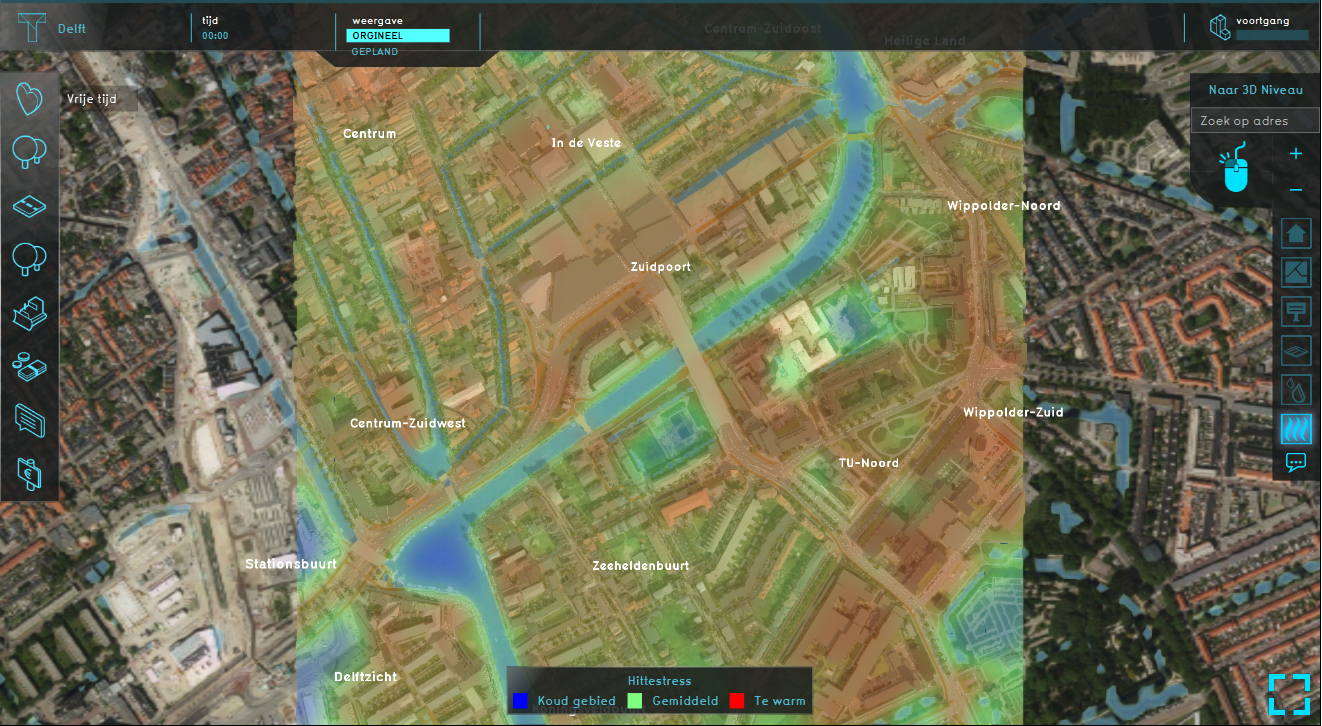
* [[UNESCO Heat Module|UNESCO Heat stress module]]. This module generates a simple heat stress overlay which visualizes the [[Pet_relative_result_type_(Heat_Overlay)|Relative Physiological equivalent temperature]] result type. It uses a different (and smaller) set of formula's to calculate Heat differences. It does not calculate the expected Physiological Equivalent Temperature. | |||
[[File:Heatstress_overlay.PNG|thumb|420px|right|Example of the UNESCO heat stress overlay]] | |||
{{Heat_Module_buttons}} | |||
{{clear}} | |||
== | {{article end | ||
|notes= | |||
* The Heat Stress Overlay certain [[past projects]] used the [[UNESCO Heat Module]], rather than the [[DPRA Heat Module]], for legacy reasons. | |||
|howtos= | |||
* [[How to add and remove an Overlay]] | |||
* [[How to edit an overlay legend]] | |||
* [[How to use a Infrared WMS to estimate foliage height]] | |||
* [[How to improve the estimated foliage overlay]] | |||
* [[How to compute additional shadow effects for the Heat Stress Overlay]] | |||
|seealso= | |||
* [[FAQ (Heat Overlay)]] | |||
}} | |||
{{HeatOverlay result type nav}} | |||
{{Overlay nav}} | |||
[[Category:Overlays with result types]] | |||
[[ | |||
Latest revision as of 08:41, 7 November 2024
The new Heat Stress Overlay module is in accordance with the 2019 DPRA Heat stress report.
Modules
In order to configure a Heat Stress Overlay, a module has to be selected. The module can be configured by opening the Heat Overlay Wizard.
The selectable modules are:
- DPRA Heat stress module. This module is more detailed and based on the 2019 DPRA Heat stress report. It can generate multiple Heat Overlay result types as child overlays;
- UNESCO Heat stress module. This module generates a simple heat stress overlay which visualizes the Relative Physiological equivalent temperature result type. It uses a different (and smaller) set of formula's to calculate Heat differences. It does not calculate the expected Physiological Equivalent Temperature.
Notes
- The Heat Stress Overlay certain past projects used the UNESCO Heat Module, rather than the DPRA Heat Module, for legacy reasons.
How-to's
- How to add and remove an Overlay
- How to edit an overlay legend
- How to use a Infrared WMS to estimate foliage height
- How to improve the estimated foliage overlay
- How to compute additional shadow effects for the Heat Stress Overlay
See also


