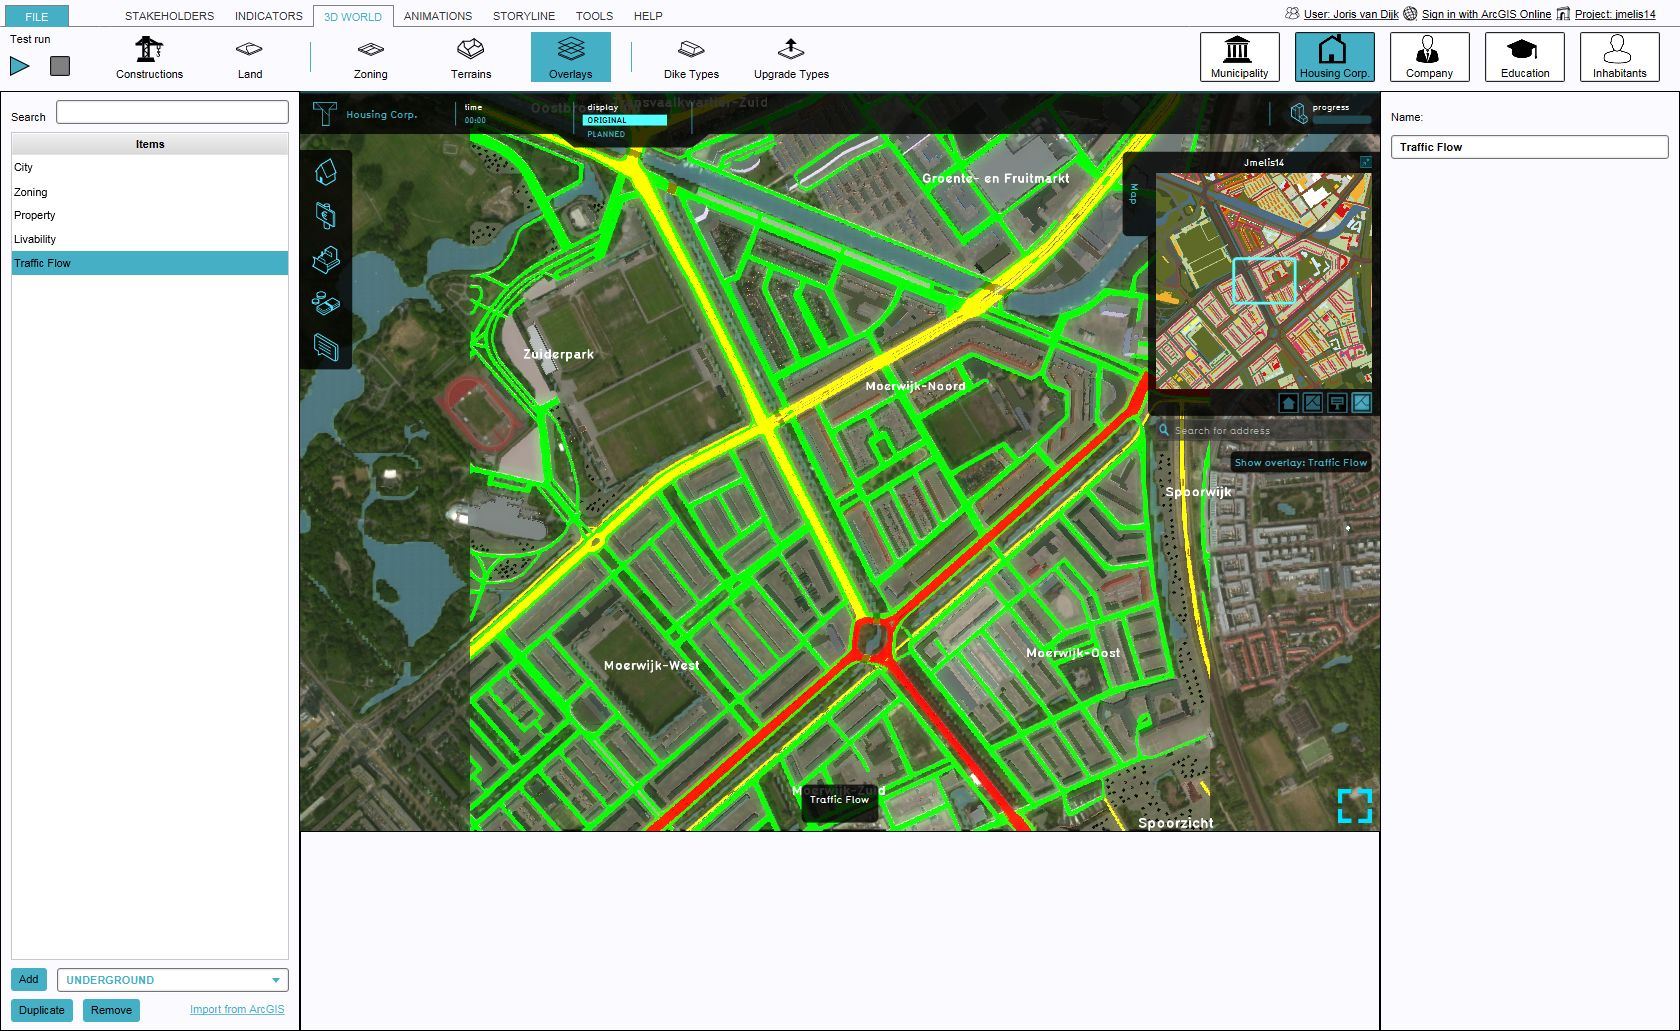
Traffic Density Overlay
The traffic Density Overlay is a Traffic Overlay which provides a general overview of the amounts of traffic. It used the Traffic Function Values to compute the total amount of vehicles per hour, and shows whether this falls into one of three categories of intensity.
Configuration
- Main article: Model attributes (Traffic Density Overlay)
The Traffic Distance Overlay has a number of options which allow it to be configured as desired.
Traffic
Traffic intensities are based solely on the Attributes of roads present in the project.
The traffic intensities can be defined as either a single value or as 24 hours, with each value corresponding to each hour of the day. The intensity used for the calculation is then defined by the HOURS model Attribute.
Calculation
- Main article: Density formula (Traffic Distance Overlay)
The Overlay calculates the total amount of vehicles for each location in the project, based on the Overlay's Attributes, and the Attributes of roads in the project.
Results
The Overlay show one of three colors, depending on whether the total amount of vehicles present in any location. The color will either match a quiet category (if the total amount of vehicles is less than a minimum amount), an average category (if the total amount of vehicles exceeds the minimum amount but not the threshold for being busy), or a busy category (if the threshold for busy is also exceeded).
The Overlay can display one or more Timeframes, as configured by its HOURS Attribute.
The hover panel will display, for any given location, the amount of vehicles per hour per category of vehicles. Although not used in the Overlay's calculations, it also displays the jam factor per traffic category, the maximum speed, and the Timeframe (hour of the day) currently visualized by the Overlay.
Notes
- The Traffic Density Overlay is not a Grid Overlay. It cannot be used as a Prequel for other computations.
How-to's
