Indicator

Indicators are named after Key Performance Indicators, which serve as a means to identify potential improvements, and as a metric for the degree to which those improvements have been successful.
Indicators are visible at the top of the interface. Each indicator is represented by a short name, and (with exception of the budget) is accompanied by a small progress bar to indicate how well you are performing on that indicator. Indicators can also be inspected by clicking on its element in the top bar, which opens the indicator panel.
In the indicator panel, the indicator's full name is shown in the title, along with a description and indicator progress on the left. On the right part of this panel a calculated score and an explanation are shown. The score and explanation are produced by the indicator's Excel Sheet. Basically, this excel sheet should be able to calculate a score and an explanation and place this in designated excel sheet cells. The excel sheet is also able to obtain information from a project using Tygron Query Language (TQL) statements. For more in depth information on indicator excel sheets, see Excel and Excel indicator.

See also the F.A.Q. webinar for an explanation about Indicators.
Relation to stakeholders
By default, when adding an indicator, it is visible and accessible by all stakeholders, through an icon in the top bar. Access to an indicator can be restricted when it is made personal; a link to a stakeholder can be configured for an indicator. This stakeholder is then considered the owner of the indicator.
For more information on adding and removing indicators to stakeholders, see stakeholders.
This relationship between an indicator and its personal stakeholder can be queried using TQL:
- Stakeholder name:
SELECT_NAME_WHERE_INDICATOR_IS_17_AND_RELATION_IS_OWNER - Stakeholder id:
SELECT_ID_WHERE_INDICATOR_IS_17_AND_RELATION_IS_OWNER
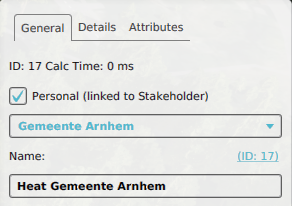
A personal heat indicator for the municipality. It is only visible in the top bar for this specific stakeholder.

Influencing Indicators
During a session, users' actions can influence Indicators, directly by spatial adjustments and spatial TQL statements and indirectly through Grid Overlay results and subsequent Grid TQL statements. It is up to the users to adjust their actions to improve the score on their Indicators. Also note that an action can also have effects on personal indicators of other stakeholders. For example, if a project developer creates a large office park where there previously was a forest, the amount of green will go down, which will negatively affect the goals of a municipality.
You can also import indicators from the GeoShare. There is a set of indicators made available in the public domain of the GeoShare. It is also possible to import indicators from GeoShare of your domain. All indicators from the default public share have a page on the wiki with an additional explanation, which indicates if you need to add or edit something to your project when you import that indicator. For Example, some indicators make use of multiple Globals, an Overlay or Areas that needs to be implemented in order for the indicator to work.
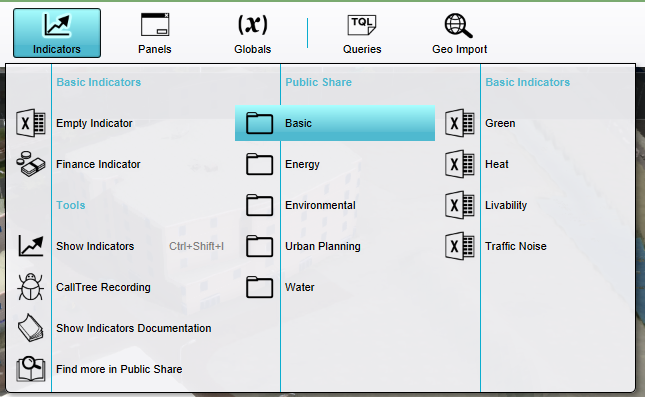
The default indicators shown in the indicators tab in the editor.
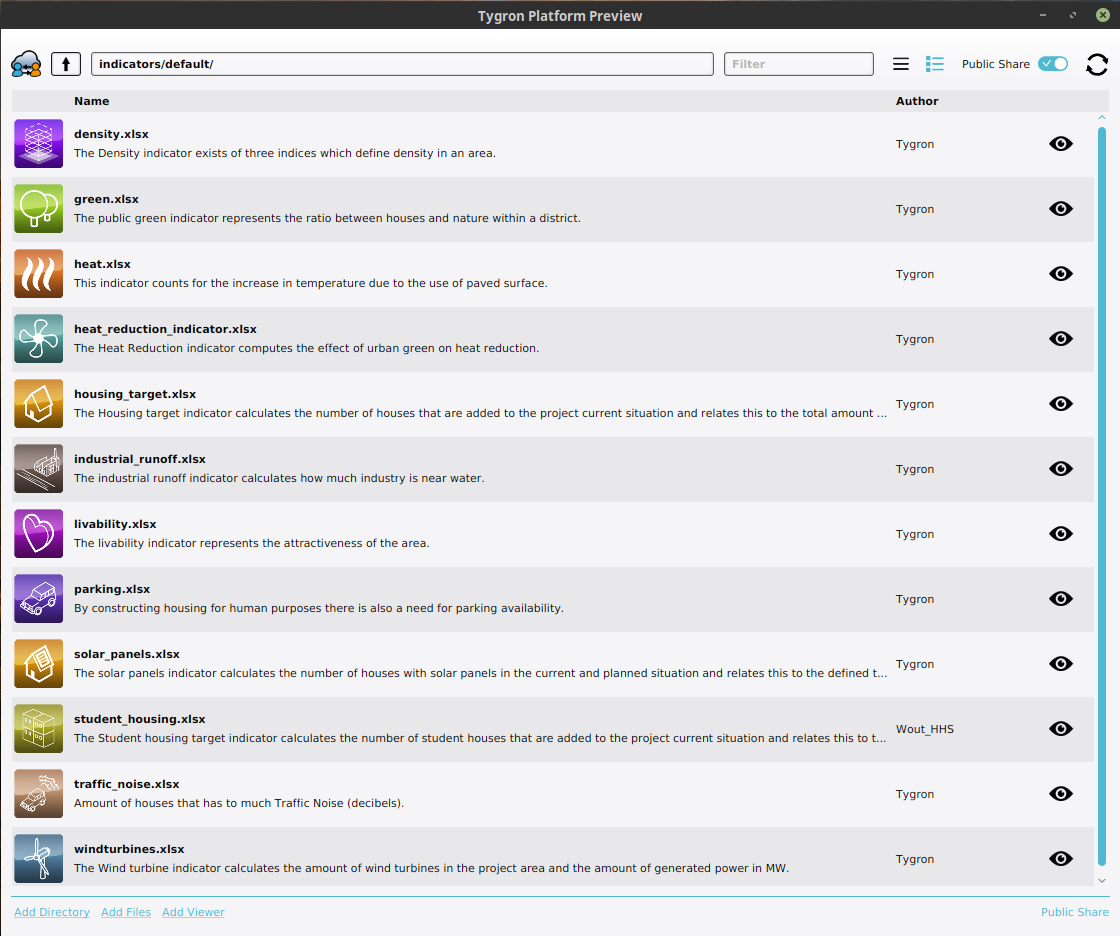
The indicators shown in the public GeoShare.


The available default indicators are listed below. Some of these indicators already perform specific calculations and can be directly used in the project. They can also be modified and extended with adjusted calculations. It is also possible to implement your own indicator, using an Excel file. This Excel file should be imported into your project and assigned to an indicator. Each added indicator is initially empty, and will require some work to set up, but it is highly customizable.
Personal Indicators
The following indicators are personal indicators by default:
| Type | Main Article | Description |
|---|---|---|
| Budget | Budget (Indicator) | The amount of money available to a stakeholder. Most actions in the Tygron Platform require money by default. Actions which require spending more money than the stakeholder has available are sometimes allowed. However, should the stakeholder end up with a negative budget, their final score will be zero until their budget turns positive. |
The following indicators are shared by default:
| Type | Main Article | Description |
|---|---|---|
| Density | Density indicators | The Density indicator exists of three indices which defined density in an area. These are:
|
| Green | Green (Indicator) | The public green indicator represents the ratio between houses and nature within a district. |
| Heat Stress | Heat (Indicator) | Heat stress is the amount of green and water in an area versus the paved surfaces. More trees and open water areas increase the score for Heat stress. Buildings and concrete decrease the score for Heat stress. |
| Heat Reduction | Heat Reduction (Indicator) | The Heat Reduction indicator computes the effect of urban green on heat reduction. This indicator is a simplified version of an RIVM calculation model and was created for a pilot with that institution. |
| Housing target | Housing target (Indicator) | The housing target indicator calculates the number of houses that are added to a the project current situation and relates this to the total amount of houses that need to be building (target). |
| Parking | Parking (Indicator) | Parking is the amount of parking spaces in an area. Many buildings have an associated need for parking spaces nearby. By building parking facilities, the score on the Parking Indicator can be increased. |
| Livability | Livability (Indicator) | Livability is the extent to which an area is pleasant to live in. More open spaces, luxury buildings and green increase livability. Densification, poor quality buildings and lack of nature decrease Livability. |
| Traffic Noise | Traffic Noise (Indicator) | The amount of houses that have to much Traffic Noise (in dB). |
How-to's
- How to add, remove and duplicate an Indicator
- How to edit Indicator properties
- How to edit Indicator targets
- How to change Function Values for a Function, to adjust the effects actions have on Indicators.
- How to implement an Excel Indicator
- Buildings • Terrains • Administrative • Areas • Networks • Overlays • Indicators • Panels • Globals • Queries • Geo Import
- Buildings
- Function • Function Override • Traffic Units
- Terrain
- Height sector • Elevation model • Elevation GeoTIFF • Elevation Grid Overlay • Ground Price • Terrain Type • Terrain Type Override
- Administrative
- Net Cluster • Net Function • Net Line • Net Load • Net Node • Net Setting
- Editor