Livability Overlay: Difference between revisions
mNo edit summary |
No edit summary |
||
| (10 intermediate revisions by 3 users not shown) | |||
| Line 1: | Line 1: | ||
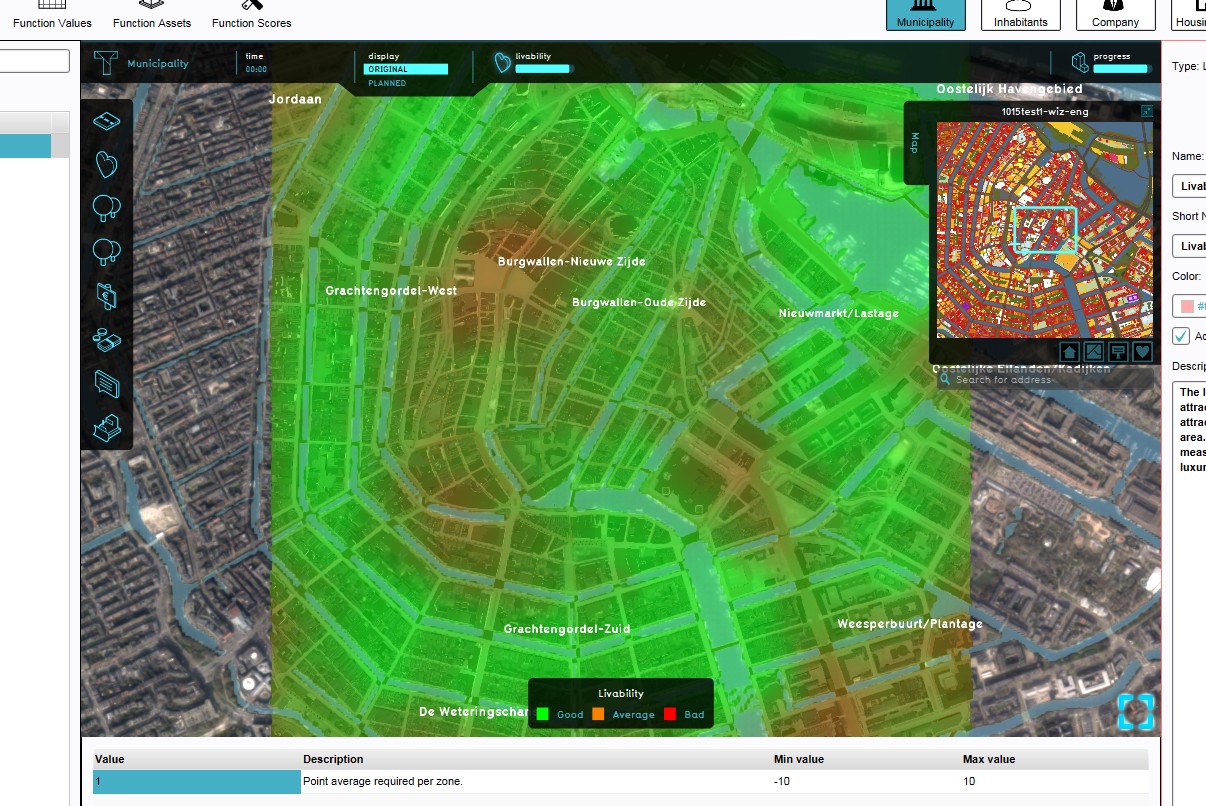
[[File:Livability-Overlay.jpg|thumb|right|Optional Livability overlay, linked to Livability indicator]] | [[File:Livability-Overlay.jpg|thumb|right|Optional Livability overlay, linked to Livability indicator]] | ||
The Livability Overlay is | The Livability [[Overlay]] is a [[grid overlay]] which displays the average livability in different colors for the project area, indicating good, average and bad livability. Each [[building]] and each [[terrain]] has a default specified [[Livability effect (Function Value)|livability effect]], based on research. The average value of a location is the combined livability effect values of the surrounding functions in a 200m radius. | ||
The livability overlay and its metric are based on the VROM commissioned "Leefbaarometer".<ref name="leidelmeijer"/> | The livability overlay and its metric are based on the VROM commissioned "Leefbaarometer".<ref name="leidelmeijer"/> | ||
| Line 21: | Line 21: | ||
====Livability in the Zone==== | ====Livability in the Zone==== | ||
The average value of the livability in the entire [[neighborhood]] | The average value of the livability in the entire [[neighborhood]] | ||
==Calculation== | |||
The calculation of livability takes place in broadly two steps. First, in every grid cell in the [[project]], the local livability value is determined. If the land is empty, this value is derived from the [[terrain|terrain type]]. If there is a building present, the [[livability effect (Function Value)|livability effect]] from the building is used. | |||
Next, for every cell, all the cells in the surrounding area are checked. Of all the cells found, the average value is taken and stored as the final value for that grid cell. | |||
The result is a grid in which the value of every cell is an average value of its surroundings. | |||
==Changing function values to change effects on the Livability== | ==Changing function values to change effects on the Livability== | ||
: '' Main article: [[Functions#Changing_function_values|Changing function values]]'' | : '' Main article: [[Functions#Changing_function_values|Changing function values]]'' | ||
{{Editor location|Function Values}} | {{Editor location|Function Values}} | ||
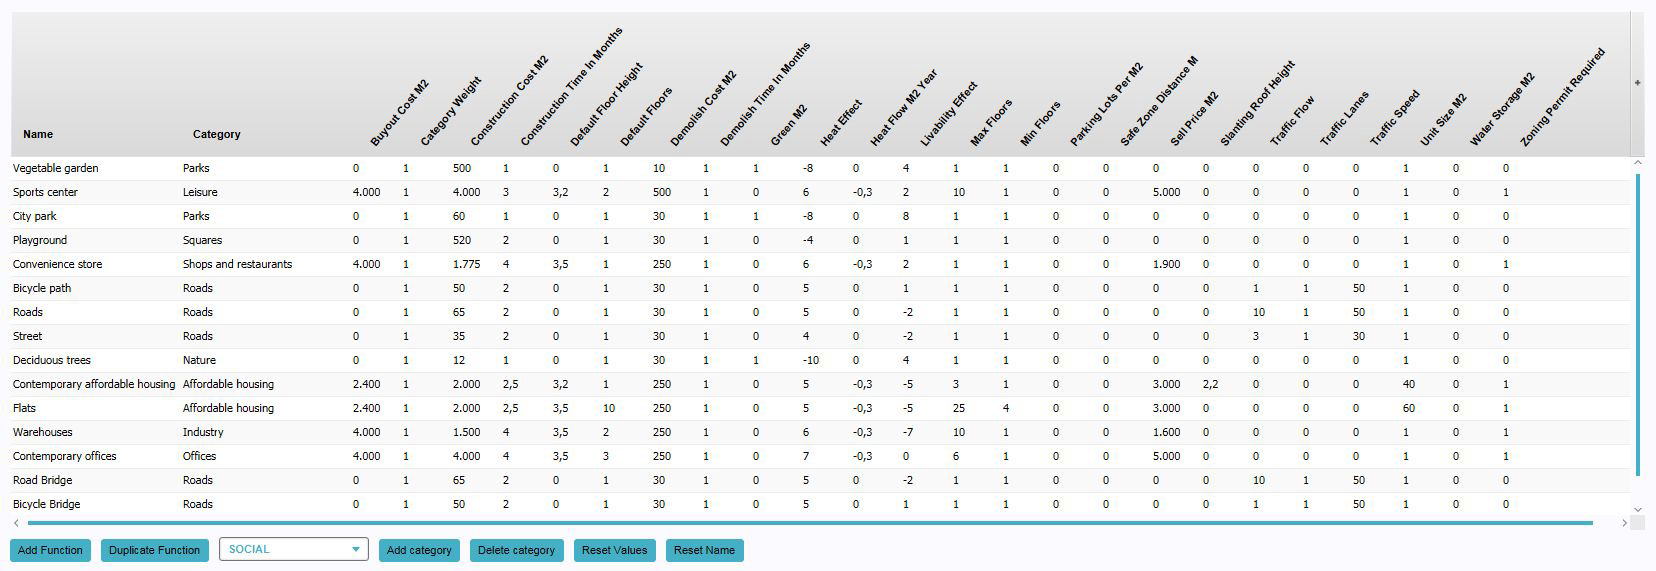
[[File:Function_values_screen.jpg|thumb|750px|left|The | [[File:Function_values_screen.jpg|thumb|750px|left|The [[Function Values Table]].]] | ||
To change a function value to affect the Livability overlay (and indicator), look for the "Livability Effect" column and change the "Livability Effect" value for a certain | To change a function value to affect the Livability overlay (and indicator), look for the "Livability Effect" column and change the "Livability Effect" value for a certain building. The overlay will update automatically. | ||
{{Editor steps|title=change function values to change effects on the Livability|Select "Indicators" in the ribbon header|Select "Function Values" in the ribbon bar |The Function Values | {{Editor steps|title=change function values to change effects on the Livability|Select "Indicators" in the ribbon header|Select "Function Values" in the ribbon bar |The [[Function Values Table]] will open |Select a function in the Function Values Table|Change the "Livability Effect" Value for the selected function |Confirm by pressing "Enter"}} | ||
{{clear}} | {{clear}} | ||
{{article end | |||
* [[How | |howtos= | ||
* [[How | * [[How to add and remove an Overlay]] | ||
* [[How to edit an overlay legend|Edit an overlay legend]] | |||
* [[How to change Function Values for a Function]] | |||
|references= | |||
<references> | <references> | ||
<ref name="leidelmeijer">Leidelmeijer, K. e. (2008). De Leefbaarometer; Leefbaarheid in Nederlandse wijken en buurten gemeten en vergeleken - in opdracht van Ministerie van VROM. Retrieved from: https://leefbaarometer.nl/resources/rapportage%20instrumentontwikkeling%20Leefbaarometer%201.0.pdf</ref> | <ref name="leidelmeijer">Leidelmeijer, K. e. (2008). De Leefbaarometer; Leefbaarheid in Nederlandse wijken en buurten gemeten en vergeleken - in opdracht van Ministerie van VROM. Retrieved from: https://leefbaarometer.nl/resources/rapportage%20instrumentontwikkeling%20Leefbaarometer%201.0.pdf</ref> | ||
</references> | </references> | ||
}} | |||
{{Template:Overlay nav}} | {{Template:Overlay nav}} | ||
Latest revision as of 14:57, 29 February 2024
The Livability Overlay is a grid overlay which displays the average livability in different colors for the project area, indicating good, average and bad livability. Each building and each terrain has a default specified livability effect, based on research. The average value of a location is the combined livability effect values of the surrounding functions in a 200m radius.
The livability overlay and its metric are based on the VROM commissioned "Leefbaarometer".[1]
Legend
- Green (Good): Indicates a good livability, compared to the surroundings.
- Orange (Average): Indicates an average livability, compared to the surroundings.
- Color: Red (Bad): Indicates a bad livability, compared to the surroundings.
Additional information displayed in hover panel
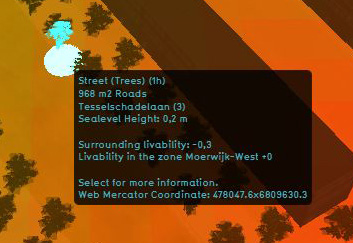
The hover panel gives additional information when the overlay is active.
Surrounding Livability
The value of livability in the surroundings.
Livability in the Zone
The average value of the livability in the entire neighborhood
Calculation
The calculation of livability takes place in broadly two steps. First, in every grid cell in the project, the local livability value is determined. If the land is empty, this value is derived from the terrain type. If there is a building present, the livability effect from the building is used.
Next, for every cell, all the cells in the surrounding area are checked. Of all the cells found, the average value is taken and stored as the final value for that grid cell.
The result is a grid in which the value of every cell is an average value of its surroundings.
Changing function values to change effects on the Livability
- Main article: Changing function values
To change a function value to affect the Livability overlay (and indicator), look for the "Livability Effect" column and change the "Livability Effect" value for a certain building. The overlay will update automatically.
- Select "Indicators" in the ribbon header
- Select "Function Values" in the ribbon bar
- The Function Values Table will open
- Select a function in the Function Values Table
- Change the "Livability Effect" Value for the selected function
- Confirm by pressing "Enter"
How-to's
- How to add and remove an Overlay
- Edit an overlay legend
- How to change Function Values for a Function
References
- ↑ Leidelmeijer, K. e. (2008). De Leefbaarometer; Leefbaarheid in Nederlandse wijken en buurten gemeten en vergeleken - in opdracht van Ministerie van VROM. Retrieved from: https://leefbaarometer.nl/resources/rapportage%20instrumentontwikkeling%20Leefbaarometer%201.0.pdf


