Basics tutorial: Difference between revisions
(Redirected page to Basic skills tutorial) Tag: New redirect |
mNo edit summary |
||
| (130 intermediate revisions by 3 users not shown) | |||
| Line 1: | Line 1: | ||
{{tutorial prerequisites | {{tutorial prerequisites | ||
|domain=Ensure your organisation's [[account management|domain administrator]] has created an account for you. | |time=3 hours | ||
|project=This tutorial will involve the creation of a new [[Project]]. | |domain=Ensure your organisation's [[account management|domain administrator]] has created an account for you. This must be an account with at least "EDITOR" rights. | ||
|project=This tutorial will involve the creation of a new [[Project]]. This [[Project]] is intended for experimentation with the features the {{software}} offers. | |||
}} | }} | ||
==Introduction to the {{software}}== | ==Introduction to the {{software}}== | ||
The {{software}} is a server-client application specializing in rapid, parallel calculations and processing of data. Organizations have license which allows access to the software, and a | The {{software}} is a server-client application specializing in rapid, parallel calculations and processing of data. Organizations have a license which allows access to the software, and a [[Domain]] which holds all the organization's [[User]] accounts and [[Project]]s. Each user within an organization that wishes to make use of the software must have an individual [[User]] account. | ||
[[Project]]s are complete sets of data representing a use-case in a real geographical location. [[Project]]s can be started as a [[Session]], which is an interactive representation of [[Project]] data. Generally, only one [[Session]] can exist per [[Project]]. | |||
When a [[Session]] is active, it is generally not possible to start a second [[Session]] while the first [[Session]] is still running. However, it is possible for multiple [[User]]s to interact with the same [[Session]] at the same time. | |||
This tutorial assumes a user account has been created with at least EDITOR rights. | This tutorial assumes a user account has been created with at least EDITOR rights. | ||
{{page_break}} | |||
==Getting started as a new user== | ==Getting started as a new user== | ||
| Line 14: | Line 19: | ||
{{install url}} | {{install url}} | ||
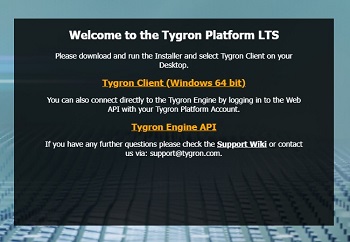
[[File:basics-editor-gsanu-download-small.jpg|frame|center|The web page will prominently present a link to download the installer.]] | |||
After the download completes, install it the application, and finally start the application. | After the download completes, install it the application, and finally start the application. | ||
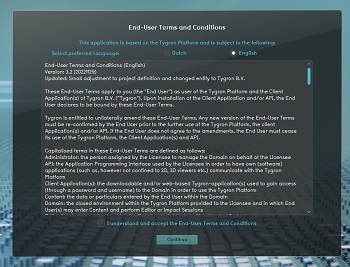
If the {{software}} has not been run recently on this computer, a prompt may appear for the [[EULA|end-user license agreement]]. If you agree with the terms, accept it. Note that accepting the EULA is required to continue this tutorial and to use the {{software}} in general. | If the {{software}} has not been run recently on this computer, a prompt may appear for the [[EULA|end-user license agreement]]. If you agree with the terms, accept it. Note that accepting the EULA is required to continue this tutorial and to use the {{software}} in general. | ||
[[File:basics-editor-gsanu-eula-small.jpg|350px|frame|center|The end-user license agreement will be shown.]] | |||
{{page_break}} | |||
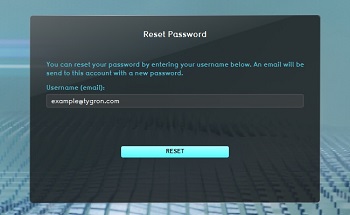
At the login screen, click on "forgot password". Enter the email associated with your account, and click on "Reset". | At the login screen, click on "forgot password". Enter the email associated with your account, and click on "Reset". | ||
[[File:basics-editor-gsanu-reset-small.jpg|frame|center|The reset password screen.]] | |||
This will prompt an email to be sent to your email account with a new password, which will allow you to log in. | This will prompt an email to be sent to your email account with a new password, which will allow you to log in. | ||
After resetting, the login screen will have reappeared. As username, enter your email. As password, enter the password sent to you in the mail. Then click on "sign in". | After resetting the password, the login screen will have reappeared. As username, enter your email. As password, enter the password sent to you in the mail. Then click on "sign in". | ||
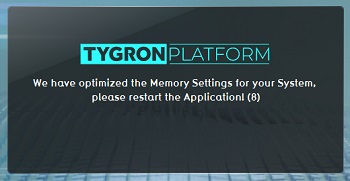
If the {{software}} has been freshly (re)installed, the application may take a moment to optimize its internal settings, so that it can maximize performance as necessary. This will force the application to close. When this happens, restart the application, and log in again. | If the {{software}} has been freshly (re)installed, the application may take a moment to optimize its internal settings, so that it can maximize performance as necessary. This will force the application to close. When this happens, restart the application, and log in again. | ||
[[File:basics-editor-gsanu-settings-small.jpg|frame|center|The software will optimize itself, and close.]] | |||
{{page_break}} | |||
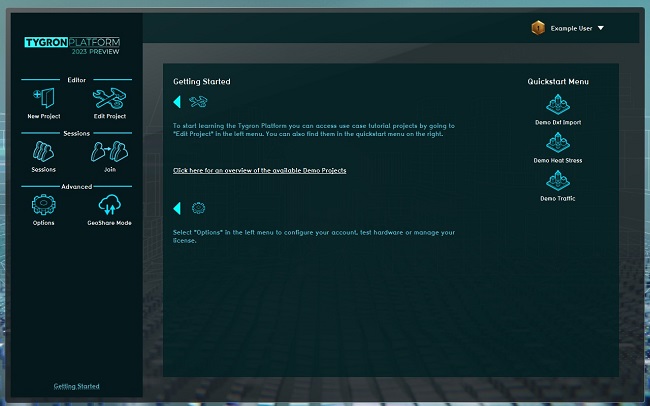
The [[main menu]] will appear. | |||
[[File:basics-editor-gsanu-mainmenu-small.jpg|frame|center|The main menu of the client application.]] | |||
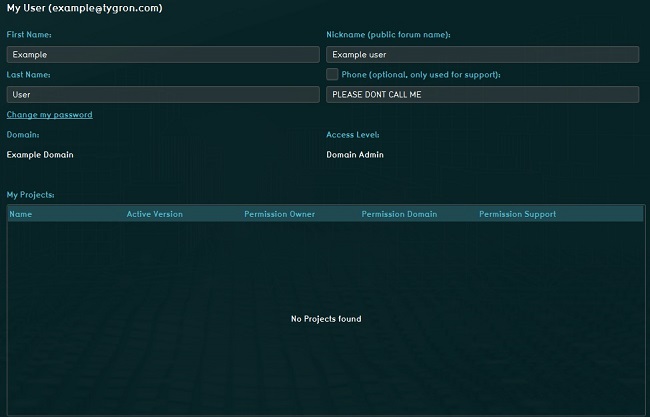
In the [[main menu]], click on "options", and then "my account". This screen will allow you to manage your own account and your own [[Project]]s. | |||
[[File:basics-editor-gsanu-myaccount-small.jpg|frame|center|The "My account" options screen, which provides access to account-related information.]] | |||
{{page_break}} | |||
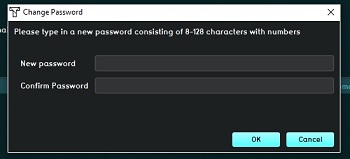
Click on "Change my password". A prompt will appear with which you can change your password to one you can remember. | |||
[[File:basics-editor-gsanu-passwordprompt-small.jpg|frame|center|Enter a new, personal password.]] | |||
Remember: do not share your password with anyone! | |||
{{page_break}} | |||
==Working with Projects== | |||
Essential for working with the {{software}} is the ability to create new [[Project]]s and manage their [[Session]]s and permissions. | |||
Creating a project will require an account with at least EDITOR rights. If you do not see the options "Create new project" or "Edit existing project" in the main menu, contact your [[account management|domain administrator]] to assign these rights to your account, as appropriate. | |||
===Creating a new Project=== | |||
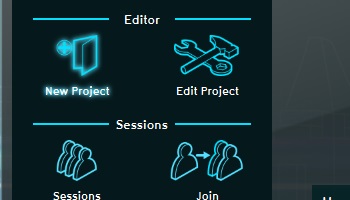
In the main menu, click on "Create new Project". | |||
[[File:basics-editor-project-mainmenu-new.jpg|frame|center|Use "New Project" to create a new Project.]] | |||
This will start the [[New Project Wizard]]. | |||
[[File:basics-editor-project-newproject-small.jpg|frame|center|The "New Project Wizard" guides the process of creating a new [[Project]].]] | |||
{{page_break}} | |||
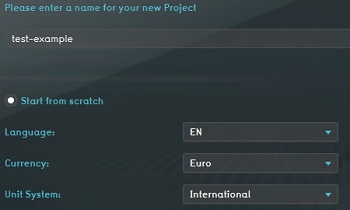
Enter a name for the new [[Project]]. A [[Project]] name should usually indicate the geographical setting where the [[Project]] is located. When creating a new [[Project]] for the purpose of experimentation, such as a tutorial, it is generally convention to have the project name indicate the person the Project belongs to, e.g. test-yourname. | |||
The name must be between 3 and 20 characters, and may consist of alphanumeric characters, spaces, and dashes. | |||
[[File:basics-editor-project-newproject-name.jpg|frame|center|Enter a project name.]] | |||
When creating a new [[Project]], it is possible to either create a new [[Project]] from scratch, or to base the new [[Project]] on a pre-existing [[Project]]. Ensure the option for creating a new project is selected. | |||
Set the [[Project]]s language to the desired language, the currency to the desired currency, and the measurement system to "international". | |||
[[File:basics-editor-project-newproject-new-small.jpg|frame|center|Settings for a new Project.]] | |||
Proceed to the next screen of the wizard by clicking on "Create new Project". | |||
{{page_break}} | |||
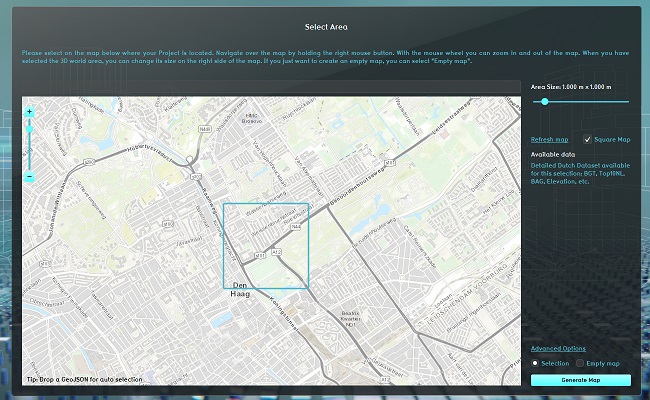
This screen allows the selection of the geographical location and size of the new Project. | |||
[[File:basics-editor-project-newproject-location-small.jpg|frame|center|The location selection screen.]] | |||
Use the search bar to locate the general area where the Project is to be located. | |||
Move the map using the right-mouse button. | |||
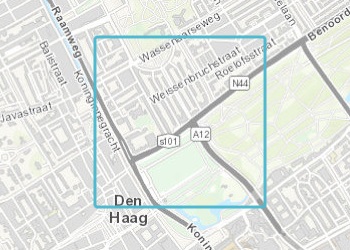
Use the left mouse button to place the blue selection zone in the appropriate location. Everything within the blue extent will be part of the Project and the 3D visualization. Anything outside the blue extent will not be part of the Project and the 3D visualization. | |||
[[File:basics-editor-project-newproject-selection.jpg|frame|center|The blue selection field indicates the extent of the Project. Align it to oncompass your area of interest.]] | |||
{{page_break}} | |||
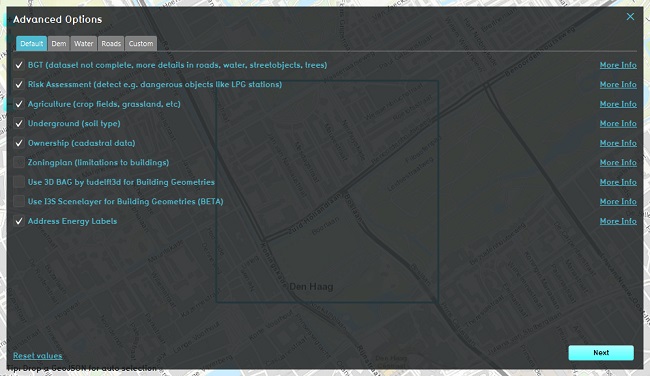
Click on "Advanced Options". This opens an additional panel in which some specific datasources can be toggled or configured. Some datasources can be explicitly includes or excluded from the process of generating the Project. | |||
[[File:basics-editor-project-newproject-advanced-small.jpg|frame|center|The advanced options allow for further configuration of what data is loaded in for the new project.]] | |||
Disable the "Ownership" options. This will disable the {{software}} from generating a complex ownership situation, which might inhibit the free application of tools for sketching a future situation using Actions. Disabling the import of ownership data is a best-practice. | |||
[[File:basics-editor-project-newproject-ownership.jpg|frame|center|Turning the ownership data off is not required, but helpful for most use-cases.]] | |||
{{page_break}} | |||
Click on "Generate". This will start the data import process on the {{software}} server. | |||
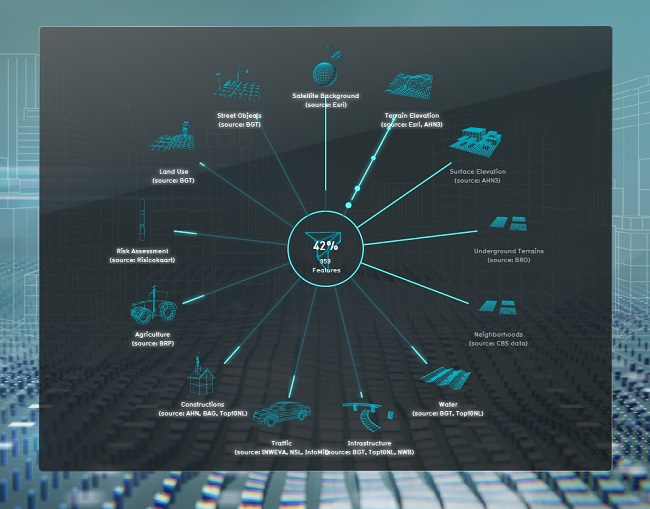
[[File:basics-editor-project-newproject-loader-small.jpg|frame|center|The {{software|engine}} is retrieving all the neccesary data. You can see the progress locally.]] | |||
After the generation process completes, the editor environment and [[3D Visualization]] will load. | |||
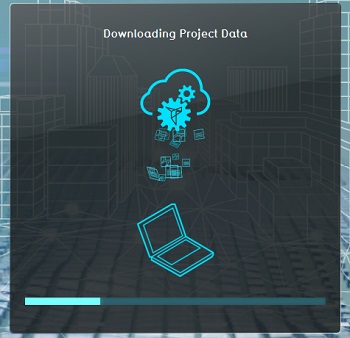
[[File:basics-editor-project-newproject-3dloader-small.jpg|frame|center|The data of the Project is being downloaded to your client application, so that the 3D world can be shown.]] | |||
{{page_break}} | |||
===Saving, and permissions=== | |||
When the [[Editor]] and the [[3D Visualization]] have loaded, it is possible to explore the data present in the project, to effect changes in the data, to add calculation models, and perform all other operations desired. | |||
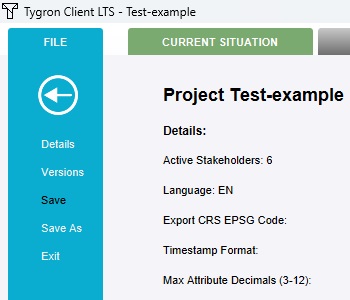
Before exploring the editor, click on "File" in the top-left corner of the screen. This will open the File menu for the Project. | |||
[[File:basics-editor-project-file.jpg|frame|center|The file menu button in the top left of the interface.]] | |||
Click on "Save" to save the Project. | |||
[[File:basics-editor-project-file-save.jpg|frame|center|Click on "Save".]] | |||
{{page_break}} | |||
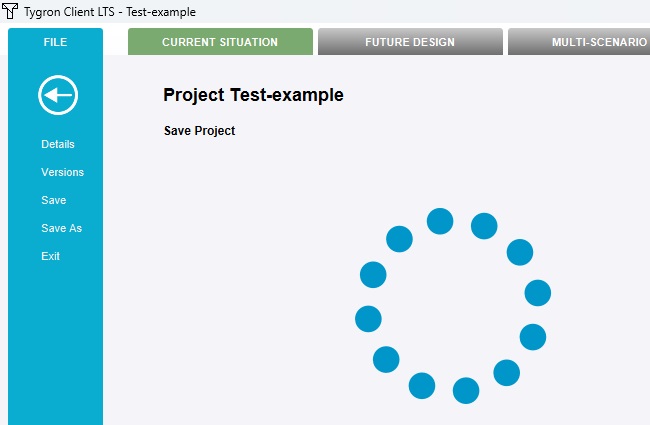
The current state of the Project will now be saved. | |||
[[File:basics-editor-project-file-saving.jpg|frame|center|Depending on the complexity of the Project, the time it takes to save may vary.]] | |||
{{page_break}} | |||
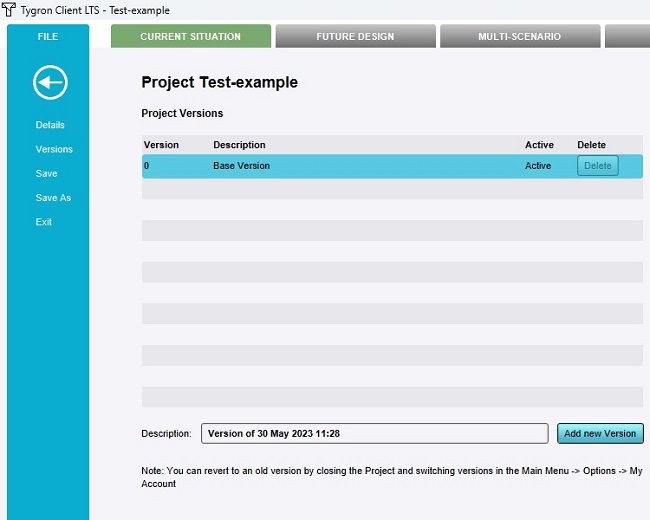
After the Project has saved, click on versions. | |||
[[File:basics-editor-project-file-versions.jpg|frame|center|The list of versions of a particular Project.]] | |||
Each Project can have a maximum of 10 versions within it. Versions are used to create known states of a Project, to which it is possible to revert if so desired. | |||
{{page_break}} | |||
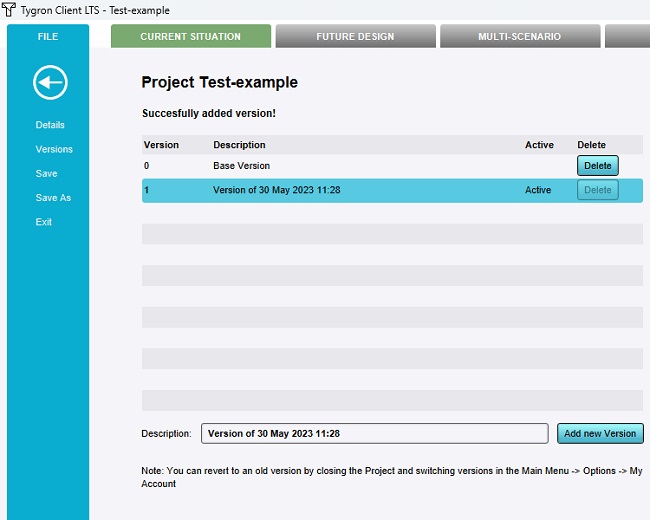
Click on "Add new version". This will save the current state of the Session in a second version. The second version will now be listed, and this new version will also be marked as active. | |||
[[File:basics-editor-project-file-newversion.jpg|frame|center|A new version is now added to the list of versions for this Project.]] | |||
If changes are now made to the Project and the Project is saved, those changed will be stored in the new version. At any point in the future, it will be possible to revert the Project back to the initial "Base Version", which will not include those changes made in the second version. | |||
It is important to note that the {{software}} does not have an "undo" button. To revert (complex) changes, the appropriate approach is to save periodically when the state of the [[Session]] is correct, using versions to maintain those states, and either closing without saving or switching to earlier versions to remove or revert the changes. | |||
{{page_break}} | |||
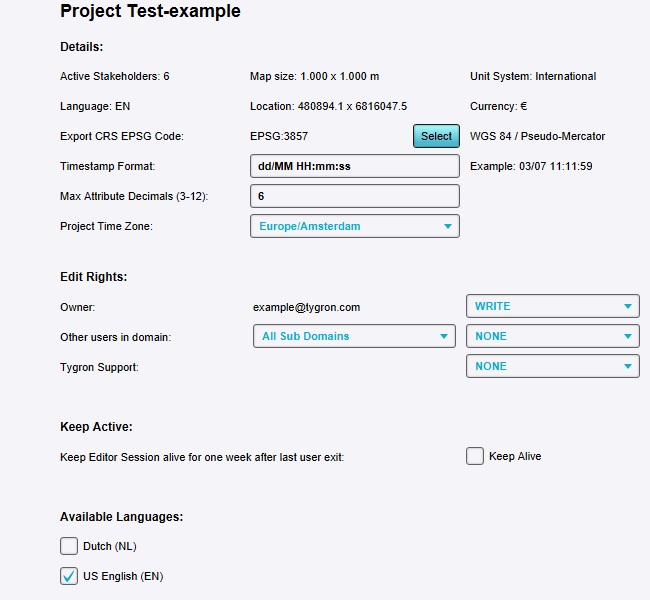
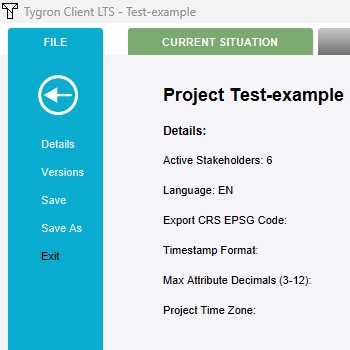
Click on "details". This will open the overview of general meta-data of the Project. | |||
[[File:basics-editor-project-file-details.jpg|frame|center|Details and meta-data of the Project.]] | |||
The meta data of a [[Project]] includes an overview of the permission which dictate who can access this Project and Session. | |||
{{page_break}} | |||
Permissions can be set for: | |||
* Owner, which is generally the [[User]] whom created the [[Project]] | |||
* Other users in Domain, which are all the [[User]]s in the same [[Domain]] | |||
* Tygron Support, which is any Tygron employees | |||
The rights for any of these can be set to any of the following levels: | |||
* NONE, which means the [[Project]] cannot be accessed. | |||
* READ, which means the [[Project]] can be opened as a [[Session]]. Data can be inspected and modified, but not saved. Saving a copy to create a new [[Project]] ''is'' allowed. | |||
* WRITE, which means the [[Project]] can be saved as well, allowed its data to be permanently changed. | |||
[[File:basics-editor-project-file-permissions.jpg|frame|center|The permissions of the Project.]] | |||
Note that any newly created Project (including one resulting from copying an existing Project), will have all rights except of that of the owner set to NONE. This is in line with Tygron's privacy-by-default policy, requiring explicit granting of access to others. | |||
Also note that because the permissions for Tygron Support are set to NONE by default, Tygron employees cannot access a Project's data without explicit approval. | |||
{{page_break}} | |||
===Closing and reopening=== | |||
In the File menu, click on "Exit". | |||
[[File:basics-editor-project-file-exit.jpg|frame|center|The option to exit the Editor enrivonment.]] | |||
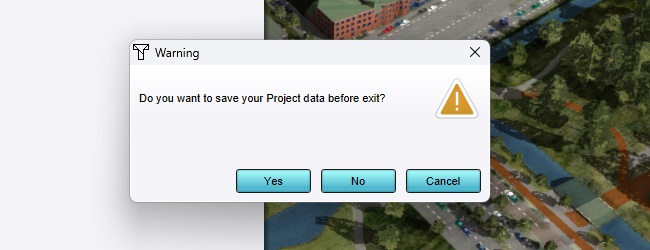
A prompt will appear to ensure you wish to exit, and whether the [[Project]] should be saved before closing. Opt to close the [[Session]], either with or without saving. | |||
[[File:basics-editor-project-file-closeprompt.jpg|frame|center|Before closing the application, confirm closing the application is intentional by indicating whether to save the Project or not.]] | |||
{{page_break}} | |||
The application will now close. The client application always closes fully when exiting a [[Session]]. Additionally, because there are no more [[User]]s active in the [[Session]], the [[Session]] itself is also ended on the server. Because the Project has been saved manually before closing it, the [[Project]] data will continue to exist on the server even after the [[Session]] has closed. | |||
Restart the application and log in again. | |||
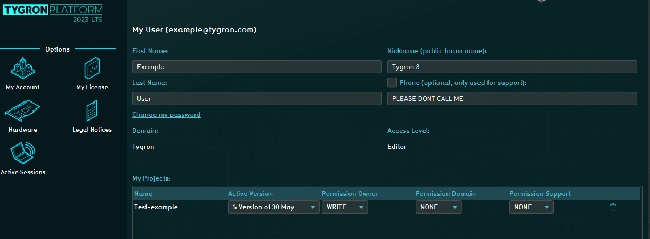
In the [[main menu]], click on "options", and then "my account". Notice that now a [[Project]] is listed, specifically the [[Project]] created previously. | |||
[[File:basics-editor-project-myaccount2.jpg|frame|center|The "My account" overview now displays a list of Projects.]] | |||
The permission settings, which could be edited from the [[Editor]], can also be set from this overview. | |||
[[File:basics-editor-project-myaccount-permissions.jpg|frame|center|Permissions for the Project listed, without opening the editor.]] | |||
Additionally, if at any point a [[Project]] should be reverted to a previous version, that can be done from this overview as well. Note that no [[Session]] of the [[Project]] may be running while changing the [[Project]]'s version. | |||
[[File:basics-editor-project-myaccount-version.jpg|frame|center|The active version of the Project can be set here.]] | |||
Finally, also take note of the option to delete any [[Project]] listed here. | |||
[[File:basics-editor-project-myaccount-delete.jpg|frame|center|The Project can be deleted with the trashcan icon.]] | |||
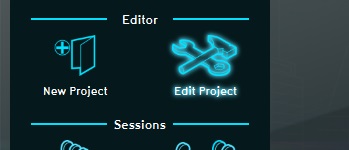
Go back to the [[main menu]], and click on "Edit Project". | |||
[[File:basics-editor-project-editproject.jpg|frame|center|Editing a Project allows for opening a Project which already exists.]] | |||
The list of [[Project]]s includes: | |||
* [[Project]]s created or owned by you. | |||
* [[Project]]s from other [[User]]s in the same [[Domain]] which have their permissions set such that they are accessible for other users in the same [[Domain]]. | |||
* [[Project]]s made globally available by {{tygron}}, such as [[List of Demo Projects|Demo projects]] | |||
<!-- | |||
[[File:basics-editor-project-projects.jpg|frame|center|The list of available Projects.]] | |||
--> | |||
Select the [[Project]] created as part of this tutorial. | |||
[[File:basics-editor-project-reselectproject.jpg|frame|center|Click on the Project to select it.]] | |||
The [[Project]] will now open in a new [[Session]], again providing an [[Editor]] environment in which it is possible to interact with the data. | |||
{{page_break}} | |||
==Interacting with Project data== | |||
[[Session]]s allow interacting with [[Project]] data, such that: | |||
* The data present in the [[Project]] is made to be more representative of reality. | |||
* Calculation models are added to analyse the data, resulting in information on a variety of theme's such as [[Heat Overlay|heat]], [[Water Overlay|water]], and [[Traffic Noise Overlay|traffic effects]]. | |||
* Tools for adding changes, from individual options for free-form drawing to complete urban plans which can be implemented integrally, are available for exploring and analyzing potential scenarios. | |||
===Structure of the editor=== | |||
The editor can be considered to consist of 2 levels of interface: | |||
* The 3D visualization and related [[user interface]] in the center of the screen, with mostly dark-colored interface elements. | |||
* The surrounding/overlaid [[editor|editing interface]], with mostly bright-colored interface elements. | |||
[[File:basics-editor-interacting-editor.jpg|frame|center|The editor, with the bright editing interface elements at the top, and the darker [[user interface]] over the [[3D Visualization]].]] | |||
{{page_break}} | |||
===Exploring the 3D visualization=== | |||
The 3D visualization is a visualization of the data in the [[Session]], as a unified 3D world. All elements which can be seen in the 3D environment are based on data present in the [[Session]]. | |||
====Camera==== | |||
The 3D visualization is facilitated through a [[camera]], which has a position (the point at which the camera is located, and looking "from"), and a focal point (the point at which the camera is directed, and looking towards). | |||
Click in the 3D world, and move the camera. Try the following motions: | |||
* Hold down the left mouse button, and drag the 3D world, to move the camera along the horizontal plane. | |||
* Hold down the right mouse button, and drag the 3D world, to rotate the camera around the point the camera is pointed at. | |||
* Scroll the scroll wheel up and down to zoom in and out. | |||
{{page_break}} | |||
There are multiple camera modes available, which can be switched between. Find the camera icon at the top right side of the [[user interface]]. | |||
[[File:basics-editor-interacting-camera-icon.jpg|frame|center|The camera icon allows switching between camera modes.]] | |||
Change the camera mode by clicking on the icon, and again try to move, rotate, and zoom the camera. | |||
Move the focal point of the camera as far to the side as possible. Notice that when the edge of the [[Project area]] is reached, it is not possible to move any further. The camera is always directed at a location inside the [[Project area]]. | |||
[[File:basics-editor-interacting-camera-edge.jpg|frame|center|The camera cannot move beyond the [[Project Area]]s edge.]] | |||
{{page_break}} | |||
====Overlays==== | |||
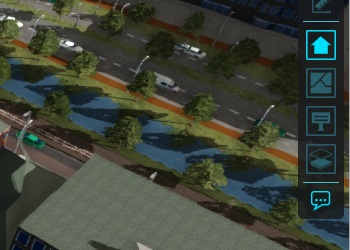
On the right side of the screen, a list of icons is displayed. These icons represent [[Overlay]]s, which are map layers which can be switched between. By default, the following [[Overlay]]s are available: | |||
{|class=wikitable | |||
! Icon !! Overlay !! Description | |||
|- | |||
|class="icon-cell"| [[File:Overlay_icon_normal.png|25px]]|| Base || Shows the 3D world as-is, without additional information. | |||
|- | |||
|class="icon-cell"| [[File:Overlay_icon_neighborhoods.png|25px]]|| Neighborhood || The [[Neighborhood]]s the world is divided up into. | |||
|- | |||
|class="icon-cell"| [[File:Overlay_icon_ownership.png|25px]]|| Ownership || Shows what areas and what [[Building]]s are owned by which [[Stakeholder]]s. | |||
|} | |||
[[File:basics-editor-interacting-overlays-list.jpg|frame|center|The list of [[Overlay]]s allow switching between different available [[Overlay]]s.]] | |||
{{page_break}} | |||
Click on the icons to switch between the [[Overlays]]. You will see the [[3D Visualization]] now includes an additional overlaid image displaying specific information. | |||
[[File:basics-editor-interacting-overlays-neighborhood.jpg|frame|center|[[Neighborhood]]s visualized by viewing the [[Neighborhoods Overlay]].]] | |||
A [[legend]] is also displayed at the bottom of the [[user interface]], clarifying the meaning of the colors of the [[Overlay]]. | |||
[[File:basics-editor-interacting-overlays-legend.jpg|frame|center|The [[legend]] of an [[Overlay]] clarifies the visualized colors.]] | |||
Note that, because the "Ownership" option was turned off while creating this [[Project]], there is no detailed ownership data available. The [[Ownership Overlay]] will still display the state of ownership of the data in the [[Project]], but all [[plot|land]] and [[Building]]s are owned by the default [[Stakeholder]], which is the municipality. | |||
{{page_break}} | |||
Select the base [[Overlay]] again, and click in any location in the 3D visualization. A [[hover panel]] will appear, giving more information about that location. | |||
[[File:basics-editor-interacting-overlays-hoverpanel.jpg|frame|center|The [[hover panel]] will show more information about any selected point.]] | |||
Switch to a different [[Overlay]], and click in any location in the 3D visualization again. The [[hover panel]] will again appear. The hover panel and the active [[Overlay]] are always related, so the information displayed will always relate to the Overlay displayed. | |||
[[File:basics-editor-interacting-overlays-hoverpanel2.jpg|frame|center|The [[hover panel]] will display information relevant to the used overlay.]] | |||
{{page_break}} | |||
===Exploring the editor=== | |||
Where the [[user interface]] allows for an integral look at the data via a [[3D Visualization]], the [[editor|editing interface]] allows for inspecting and modifying all data, as well as access additional tools to further interact with the [[Session]]. | |||
====Ribbon tabs==== | |||
All options in the [[editor]] are divided into groups of data and tools. The groups can be switched between using the tabs at the top of the [[ribbon]]. The tabs are: | |||
* [[Current Situation]], which defines all the base data of the [[Project]], and the calculation models with which to analyse them. | |||
* [[Future Design]], which defines the tools which can be made available to explore potential future scenarios. | |||
* [[Multi Scenario]], which defines tools to set up and compare multiple future scenarios. | |||
* [[Tools]], miscellaneous tools, including recording tools, access to the [[API]] and [[web interface]], and tools for [[Template Project|Project templating]]. | |||
* [[Community]], which provides built-in links to other parts of the {{software}} ecosystem, such as the wiki for documentation, and the forum for users to exchange knowledge and ideas. | |||
Switching between these tabs may also change parts of the [[user interface]], allowing for more ways to view and interact with the [[3D Visualization]]. | |||
[[File:basics-editor-editing-ribbon.jpg|frame|center|The [[ribbon]] of the editor features tabs, which group data of similar functional category.]] | |||
Starting out with the {{software}}, getting acquainted with, and properly using the options available which are part of the [[Current Situation]] are the essential foundation for each use-case. The functions available through the other tabs may be relevant for more specific or specialized use-cases. | |||
{{page_break}} | |||
====Browsing data types==== | |||
Ensure the "Current Situation" tab is selected. | |||
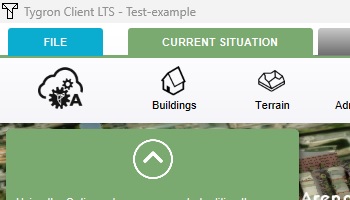
[[File:basics-editor-editing-cs.jpg|frame|center|A colored "Current Situation" tab means it is selected.]] | |||
Directly underneath the tabs in the [[ribbon]] is an overview of the data and tools which are relevant for the selected tab. In this case, the "Current Situation" provides access to data like the [[Building]]s in the [[Project Area]], terrain information such as [[elevation model|elevation]] and [[Terrain Type]]s, and the [[Overlay]]s which can be viewed. | |||
[[File:basics-editor-editing-cs-ribbon.jpg|frame|center|Options in the ribbon offer access to specific data types and functions of the editor.]] | |||
{{page_break}} | |||
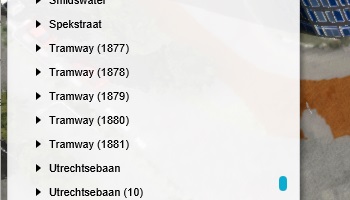
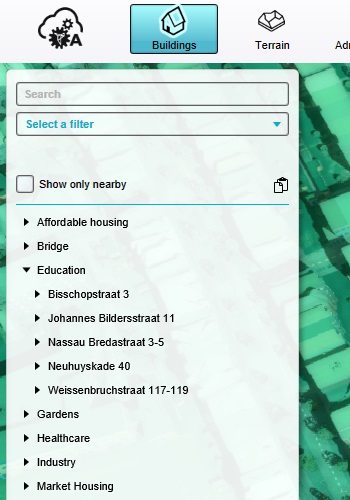
Click on "Buildings" (ignore the dropdown which appears). A [[left panel]] will appear in the [[editor]], which provides an overview of all [[Building]]s. The buildings are subdivided into categories (and [[Neighborhood]]s if there the amount of [[Building]]s warrants it). | |||
[[File:basics-editor-editing-cs-ribbon-buildings.jpg|frame|center|The [[Building]]s option selected, lists the Buildings in the [[left panel]].]] | |||
{{page_break}} | |||
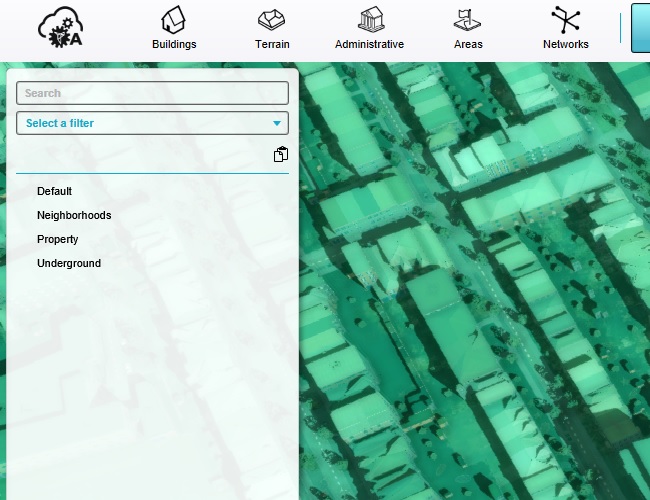
Click on "Overlays" (ignore the dropdown which appears). The [[left panel]] now lists all [[Overlay]]s currently part of the [[Session]]. Notice that the [[Overlay]]s listed in the [[left panel]] of the [[editor|editing interface]] are the same as the [[Overlay]]s listed on the right-hand side of the [[user interface]]. | |||
[[File:basics-editor-editing-cs-ribbon-overlays.jpg|frame|center|The [[Overlay]]s option selected, lists the Overlays in the [[left panel]].]] | |||
{{page_break}} | |||
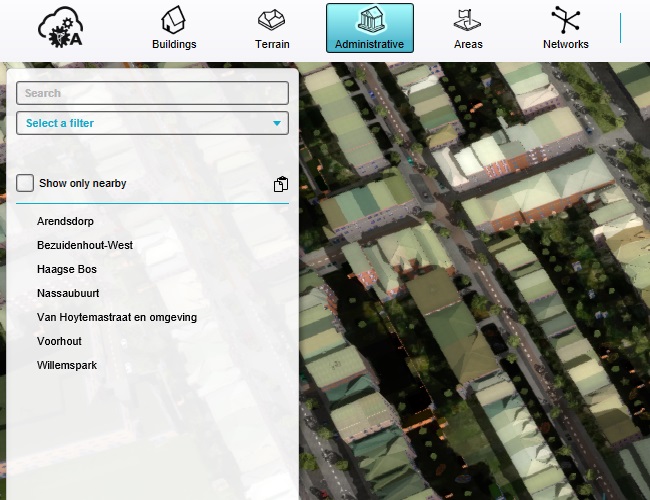
Click on "Administrative" (ignore the dropdown which appears). The [[left panel]] now lists all [[Neighborhood]]s, which are the primary administrative subdivision of most [[Project]]s. | |||
[[File:basics-editor-editing-cs-ribbon-neighborhoods.jpg|frame|center|The [[Neighborhood]]s option selected, lists the Neighborhoods in the [[left panel]].]] | |||
{{page_break}} | |||
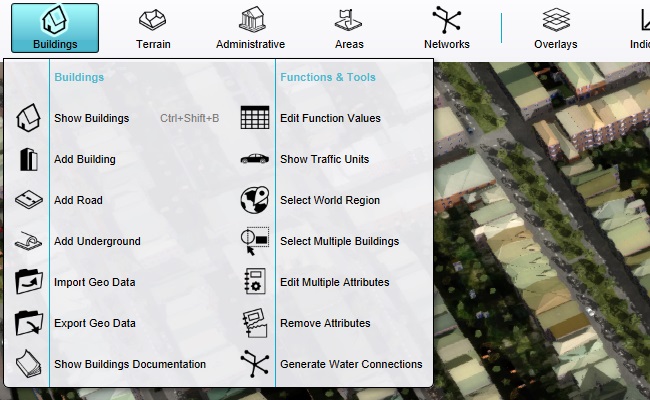
Hover over the "Buildings" button, and a dropdown will appear with further options. | |||
[[File:basics-editor-editing-cs-ribbon-buildings-dropdown.jpg|frame|center|Hovering over one of the options in the ribbon shows a dropdown.]] | |||
In general, dropdowns provide access to quick options for adding extra data of the specified type, options for data import- and export, access to related data such as typology, and access to documentation about that particular kind of data or feature. The exact contents are always dependent on the data or feature. | |||
It is good to emphasize that, in order to view any kind of data, it is sufficient to click on the button of that data. In addition, each dropdown also has the option to show a list of that data, which has the same effect as clicking the button in the [[ribbon]] directly. | |||
{{page_break}} | |||
====Inspecting specific data==== | |||
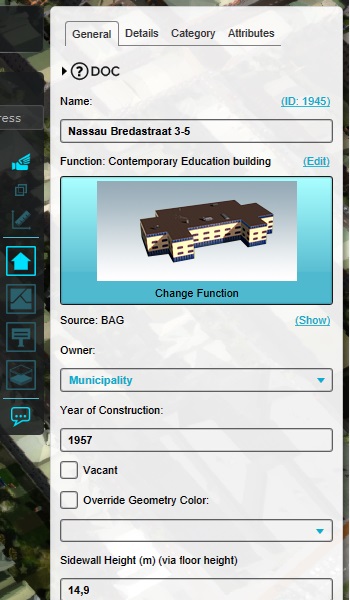
Open the list of [[Building]]s again. Select any [[Building]] in the list of [[Building]]s. The [[right panel]] will display information about the specific [[Building]] selected. | |||
[[File:basics-editor-editing-rp-building.jpg|frame|center|Details of a specific building selected in the [[left panel]], displayed in the [[right panel]].]] | |||
{{page_break}} | |||
Additionally, because a geopgraphic type of data was selected, the camera automatically moves so that the focal point is centered on selected [[Building]], which is also highlighted to show where the [[Building]] is located. | |||
[[File:basics-editor-editing-3d-highlight.jpg|frame|center|A [[Building]] selected in the [[left panel]], will also be highlighted in the [[3D Visualization]].]] | |||
For geographic types of data, it is also possible to click on the element in the [[3D Visualization]]. Click on a road where cars are visualized, so that it is highlighted in the [[3D Visualization]] and the [[right panel]] shows information about it. | |||
{{page_break}} | |||
This also works for roads (or other [[building]]s) where no cars are shown, but for a later step it is most interesting to have a road with cars. | |||
[[File:basics-editor-editing-rp-road.jpg|frame|center|A road selected. It is highlighted in the [[3D Visualization]] and its details are displayed in the [[right panel]].]] | |||
{{page_break}} | |||
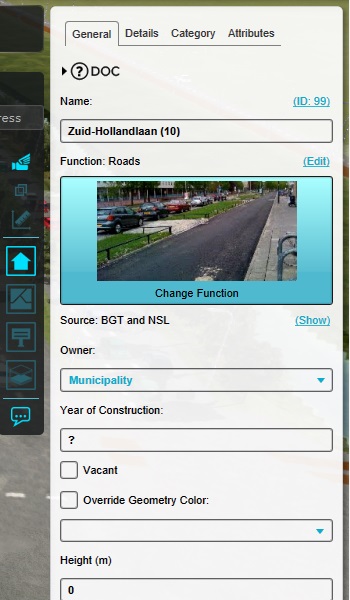
In the [[right panel]], the individual properties of the road [[building]] can be viewed. Depending on the type of data, the exact layout of the [[right panel]] of the panel will vary. For [[Building]]s, the [[right panel]] is divided into a number of tabs, with the General tab displaying some overall properties such as the name, the building type, and the owner. | |||
The General tab also displays the source for the data. If the data was created during project generation, one or more sources will be listed from which the {{software}} has derived it. | |||
[[File:basics-editor-editing-rp-general.jpg|frame|center|The General tab of the [[right panel]] usually shows all common and/or basic properties of any kind of data.]] | |||
{{page_break}} | |||
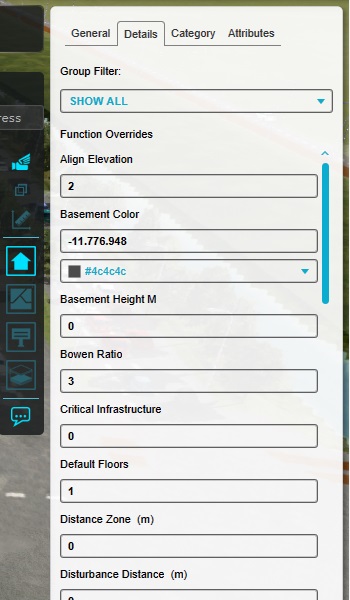
[[Building]]s also have properties divided into a Details tab and a Category tab. These tabs display a range of additional values for this [[Building]], which in the case of [[Building]]s are derived from their building type (In the {{software}} known as a [[Function]]). | |||
[[File:basics-editor-editing-rp-details.jpg|frame|center|The Details tab shows inherent [[Building]] (or [[Function|Building-type]]) properties, and the values for this particular [[Building]].]] | |||
{{page_break}} | |||
Lastly, there is the Attributes tab. This tab displays [[Attribute]]s, which are effectively miscellaneous properties the data has. In the case of a roads [[Building]] in a [[Project]] in the Netherlands, for example, an [[nwb_id (Building Attribute)|NWB_ID]] [[Attribute]] may be added to the [[Building]], which is a national standard identification for roads allowing them to be easily related back to external datasources. | |||
[[File:basics-editor-editing-rp-attributes.jpg|frame|center|The Attributes tab shows [[Attribute]]s, which can be any additionally assigned property.]] | |||
[[Attribute]]s are a form of property related to many kinds of data, and can generally be used to hold any form of (custom) numeric value. working with [[Attribute]]s is outside of the scope of this tutorial. | |||
{{page_break}} | |||
====Changing data==== | |||
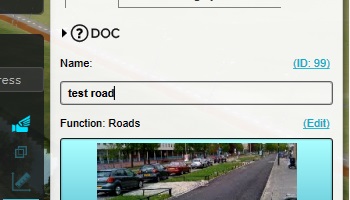
Data in the [[right panel]] can also be easily changed. Switch to the General tab, and change the name of the road to "test road". | |||
[[File:basics-editor-editing-rp-namechanged.jpg|frame|center|The name of the road has been changed to "test road".]] | |||
In the [[3D Visualization]], click on the road again so the [[hover panel]] appears. Notice the hover panel now displays the name "test road". | |||
[[File:basics-editor-editing-hoverpanel-name.jpg|frame|center|"The [[hover panel]] now displays the "test road" name.]] | |||
{{page_break}} | |||
Switch to the Details tab, and find the "Cars / hour" value. | |||
Note that it is easier to browse this particular overview by using the "Group Filter" option at the top to filter for only TRAFFIC-related values. | |||
[[File:basics-editor-editing-rp-traffic.jpg|frame|center|Traffic-related values for this [[Building]].]] | |||
Some (or all) of the values are shown in black, and some values may be shown in red. Because the [[Building]] is of a certain [[Function]] (which is effectively a building type), values are derived from that [[function]]. However, some values may be known for this [[Building]] in particular. These are the values that are shown in red, which are values which are related to the actual [[Building]] itself, rather than being inherited from the type of building it is. | |||
Change the "Cars / hour" value to a value 10 times as much. | |||
[[File:basics-editor-editing-rp-manycars.jpg|frame|center|The amount of cars for the road has been increased ten-fold.]] | |||
{{page_break}} | |||
Notice the [[3D Visualization]] now updates, and the amount of cars visualized on the road has increased significantly. | |||
[[File:basics-editor-editing-3d-manycars.jpg|frame|center|The road is now entirely full of cars, but only on the modified road.]] | |||
{{page_break}} | |||
====Adding and removing data==== | |||
Data can also be added and removed entirely. In the [[left panel]], ensure the "test road" building is selected. At the bottom of the [[left panel]], click on "Remove". | |||
[[File:basics-editor-editing-lp-remove.jpg|frame|center|The "Remove" button can be found in the bottom-left of the [[left panel]].]] | |||
A prompt will appear to verify the [[building]] should be removed, and that the action cannot be undone. Confirm the action, and the [[Building]] will disappear from the [[3D Visualization]]. The road is now removed from the [[Session]]. | |||
[[File:basics-editor-editing-lp-removed.jpg|frame|center|The road "test road" is no longer listed.]] | |||
{{page_break}} | |||
The road is also visually removed from the [[3D Visualization]]. A new [[Building]] (of the same or a different [[Function]]) can be added in its place. | |||
[[File:basics-editor-editing-3d-roadgone.jpg|frame|center|The road is also removed from the [[3D Visualization]].]] | |||
At the bottom of the screen, set the add-type dropdown to "ROAD", and click on "Add". | |||
[[File:basics-editor-editing-lp-addroad.jpg|frame|center|Clicking "Add" will result in a new [[Building]] being added to the [[Session]].]] | |||
{{page_break}} | |||
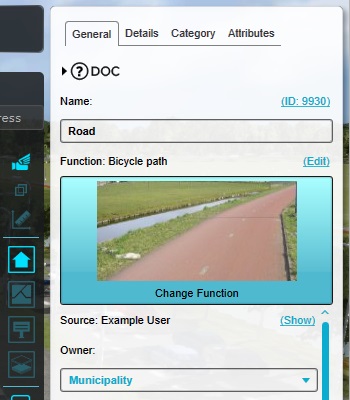
A new [[Building]], named "Road", will now be listed in the [[left panel]]. It is automatically selected in the [[left panel]], and details of it are displayed in the [[right panel]]. | |||
Besides its default name, it is immediately assigned a [[Function]] as well. | |||
Also take note of the "Source", which now lists you as the origin of the data. | |||
[[File:basics-editor-editing-rp-newroad.jpg|frame|center|The [[right panel]] shows the newly added [[Building]]. The current user is listed as the Source for this [[Building]].]] | |||
{{page_break}} | |||
====Drawing data==== | |||
This new [[Building]] exists in the [[Session]] data, but is not yet visualized. This is because the [[Building]] has not yet been assigned a location. | |||
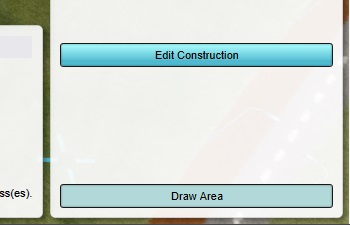
At the bottom of the [[right panel]], click on "Draw Area". | |||
[[File:basics-editor-editing-rp-drawarea.jpg|frame|center|The "Draw area" option. For (almost) all drawable data a similar option exists in the same location.]] | |||
The [[bottom panel]] will now present a number of [[brush|selection drawing tool]]s, and is known as the [[brush panel]]. | |||
[[File:basics-editor-editing-bp-brush.jpg|frame|center|The [[brush panel]] offers options to draw a selection in the [[3D Visualization]].]] | |||
{{page_break}} | |||
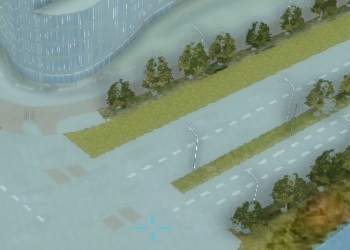
The [[3D Visualization]] will also change, to show show where a selection can or cannot be drawn. Any place where the usual visualization can be seen is a valid location for a selection. Any place where a gray layer fades out the usual visualization is an invalid location for a selection. | |||
For [[Building]]s, the most common reason for locations being invalid to draw is because there is already a [[Building]] in that location. However, because a road was removed previously, a free location exists where the new [[Building]] can be drawn. | |||
[[File:basics-editor-editing-3d-drawguide.jpg|frame|center|The visualization of where a selection can be validly drawn.]] | |||
Left-click on one end of the free location where the new [[Building]] can be drawn. Then move the mouse so that a selection appears and extends across the intended location. When the selection is oriented appropriately, left-click again to place it. | |||
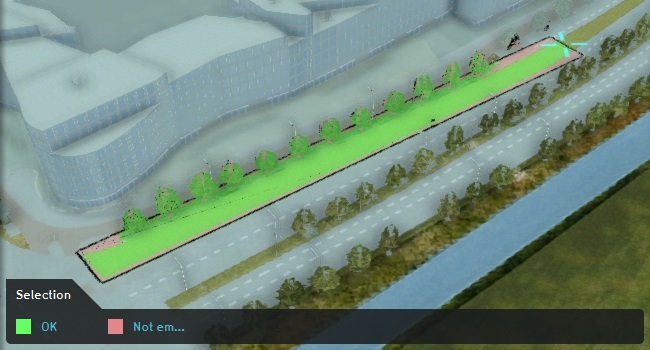
Parts of the drawn selection may be green, and parts of the selection may be red. Do not worry about the red parts, they will be automatically ignored. Only the green parts of the drawn selection will actually be used. | |||
[[File:basics-editor-editing-3d-drawn.jpg|frame|center|A drawn selection, with green valid parts and red invalid parts. Only the green parts are used when the selection is confirmed.]] | |||
{{page_break}} | |||
A selection is now drawn in the [[3D Visualization]]. In the [[bottom panel]], click on "Apply selection". This will confirm that the selection which was drawn should be added to the polygons which compose the [[Building]]. This change to the [[Building]] also triggers an update of the [[3D Visualization]] again, and the new road will appear. | |||
[[File:basics-editor-editing-3d-added.jpg|frame|center|A new road has been placed in the location where the (valid part of) the selection was drawn.]] | |||
Because the [[Building]] which was drawn is a road, the "selection type" in the brush panel was automatically configured as a line. Although a broader explanation about using all the option in the [[brush panel]] is not part of this tutorial, it is worth noting that the precise default selection type may differ for different types of data, but that it is almost always possible to switch between selecton types. | |||
{{page_break}} | |||
===Essential data types=== | |||
The {{software}} has a range of data types which can be added and/or edited in any given [[Session]]. Not all types of data are equally relevant for every use-case, but it is good to have a general overview of the kinds of data available and how they are generally structured. | |||
For each type of data, a general description will be provided here. For more information on any specific data type, review the documentation available for those topics. | |||
====Buildings==== | |||
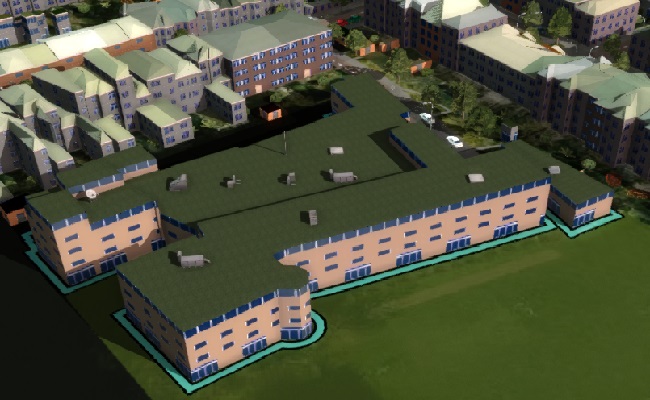
[[File:basics-editor-essentials-buildings.jpg|thumb|right|[[Building]]s are present in just about all [[Project]]s, and are prominent and detailed.]] | |||
{{main|Building}} | |||
[[Building]]s have already been explored in a previous step, but are one of the most important types of data in any [[Project]]. [[Building]]s are effectively all spatial features in any geographic extent. Among other things, all of the following are known as [[Building]]s in the {{software}}: | |||
* Houses | |||
* Apartment complexes | |||
* Offices | |||
* Retail venues | |||
* Roads | |||
* Parking lots | |||
* Trees | |||
* Benches | |||
* Crop fields | |||
The most important notable exception is water, which is a [[Terrain Type|type of Terrain]]. | |||
[[Building]]s inherit their properties from [[Function]]s, which can be considered the abstract building types. Each [[Building]] has the same properties as the [[Function]] it inherits from, unless that [[Building]] has values defined for it specifically. | |||
[[Building]]s can be seen in the [[3D Visualization]], with a model and textures which are defined by their [[Function]]. | |||
[[Building]]s consist of one or more sections. Buildings having sections allow for different parts of the same [[Building]] to have different amount of floors. This means that to set the floors for a [[Building]], that property of the section(s) must be edited. Other than that, details about [[Building]]s can be edited freely without looking at individual sections. | |||
{{clear}}{{page_break}} | |||
====Terrains==== | |||
[[File:basics-editor-essentials-terrains.jpg|thumb|right|[[Terrain]]s are present in all [[Project]]s. Especially water is relevant.]] | |||
{{main|Terrain Type}} | |||
[[Terrain]] is the definition of the surface and subsoil. Each location has both exactly one surface [[Terrain Type]], and exactly one underground [[Terrain Type]]. | |||
[[Terrain Type]]s may inherit from other [[Terrain Type]]s. Similar to [[Building]]s, their properties are derived from the [[Terrain Type]]s they inherit from, but can also have their own values set. | |||
There is, effectively, no such thing as a [[Terrain]] to edit separately from a [[Terrain Type]]. Instead, [[Terrain Type]]s are drawn directly into the [[Project Area]]. | |||
Surface [[Terrain]] can be seen in the [[3D Visualization]], with a height defined by the [[elevation model]], and a texture defined by the [[Terrain Type]]. | |||
Underground [[Terrain]] can be visualized using an [[Underground Overlay]]. | |||
[[Terrain]] also encompasses (and may refer to) the [[elevation model]], also known as the terrain height. | |||
{{clear}} | |||
====Neighborhoods==== | |||
[[File:basics-editor-essentials-neighborhoods.jpg|thumb|right|[[Neighborhood]]s are present in just about all [[Project]]s, and form usable administrative subdivisions of any [[Project]]'s extent.]] | |||
{{main|Neighborhoods}} | |||
[[Neighborhood]]s have already been briefly touched upon, but warrant some additional attention. [[Neighborhood]]s are administrative subdivisions. They are generally used as a default way to divide the [[Project Area]] up into smaller sections to aggregate results for, so that any results or changes become more manageable. In addition, for [[Project]]s in the Netherlands the CBS datasource will also provide a wide range of demographic attributes about the [[Neighborhood]]s when a new [[Project]] is generated. | |||
Every location has at most one [[Neighborhood]], and the entire [[Project Area]] should be covered by the complete set of known [[Neighborhood]]s. It is possible for a location to not be covered by a [[Neighborhood]], but this is not a usual situation. | |||
[[Neighborhood]]s can be visualized using a [[Neighborhoods Overlay]]. | |||
{{clear}}{{page_break}} | |||
====Areas==== | |||
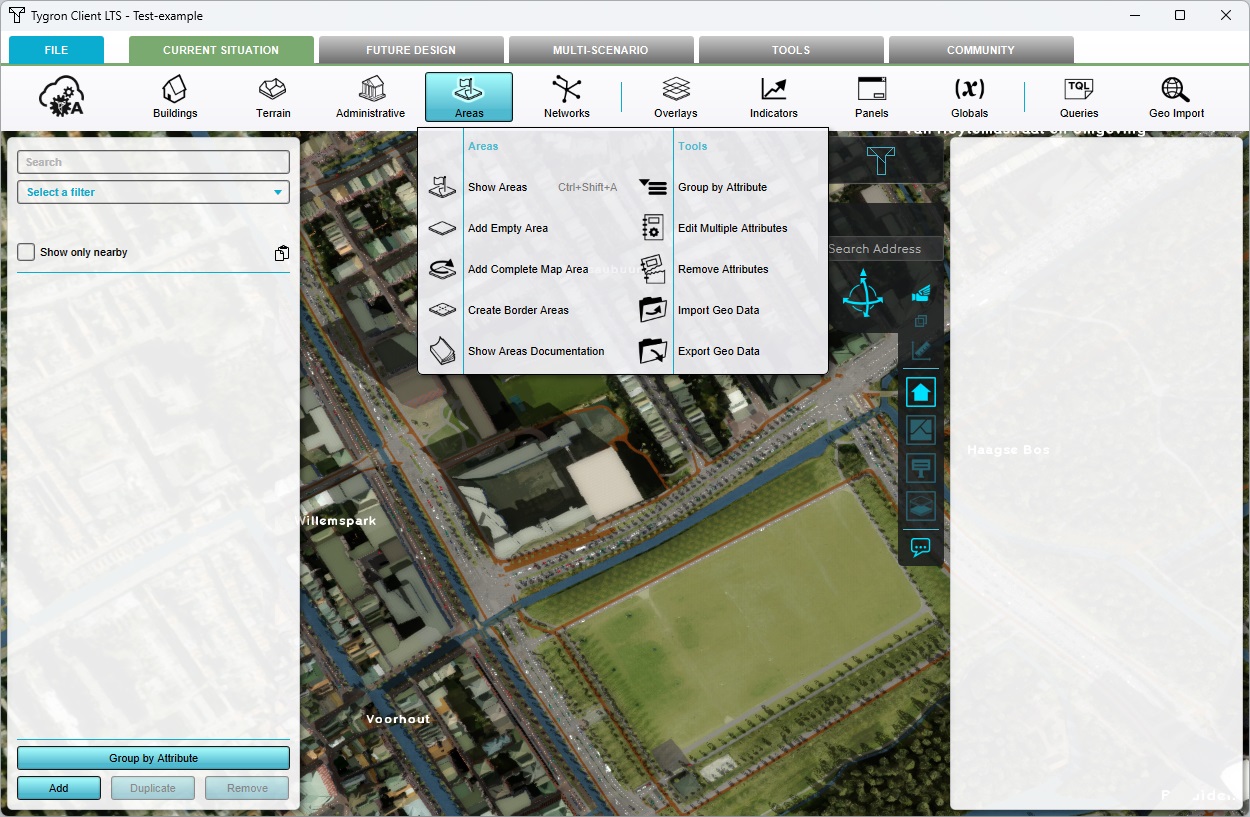
[[File:basics-editor-essentials-areas.jpg|thumb|right|[[Area]]s are custom data, and not present in a [[Project]] by default. But they offer a flexible extra spatial data layer.]] | |||
{{main|Area}} | |||
[[Area]]s are a vague but useful datatype which can best be summarized as "arbitrary [[Polygon]]s with [[Attribute]]s". They are shapes which can be placed anywhere in the [[Project Area]] to represent data. They have no inherent meaning in the {{software}}, but can be used for any number of definitions which do not fit neatly into other categories of data provided. Some uses include: | |||
* Indicating locations of spatial interest, such as archaeology of subsoil contamination | |||
* Creating additional/alternative spatial subdivisions with which to calculate data or aggregate results, instead of on a [[Neighborhood]] level. | |||
* Defining geographical policy areas for, for example, the [[Water Module]]. This includes [[Water area (Water Overlay)|Water Area]]s and [[Sewer area (Water Overlay)|Sewer area]]s. | |||
* Defining geographical spatial features without affecting the [[Building]]s layer, such as [[Folage Area (Heat Overlay)|Foliage]] for the [[Heat Module]]. | |||
{{clear}} | |||
====Overlays==== | |||
[[File:basics-editor-essentials-overlays.jpg|thumb|right|[[Overlay]]s provide spatial insight into data. They can also be used to define (simple or complex) spatial calculations.]] | |||
{{main|Overlay}} | |||
[[Overlays]]s have already been touched upon in a previous step, but are one of the most important types of data in any [[Project]]. As a first principle, they are map layers which display information already present in a [[Session]], but which may not be directly visible in the [[3D Visualization]] as is, such as the division of [[Neighborhood]]s. | |||
[[Overlay]]s can also perform spatial calculations. These [[Overlay]]s are known as [[Grid Overlay]]s, as they function by interpreting the [[Project area]] as a grid consisting of a large number of cells. A calculation is then run for every individual cell. | |||
Some [[Grid Overlay]]s are relatively simple, such as the [[Digital Surface Model Overlay|Elevation Overlay]]s or the [[Average Overlay|Average Overlay]]. Other [[Grid Overlay]]s are the practical implementations of fully-fledged calculation models, such as the [[Water Overlay]] or the [[Heat Overlay]]. | |||
[[Overlay]]s are a form of data which is part of the [[Session]], but are not themselves geographical data in the [[Project Area]]. Instead they are definitions for available map layers and calculation models, the output of which are geographically visible. | |||
{{clear}}{{page_break}} | |||
====Indicators==== | |||
[[File:basics-editor-essentials-indicators.jpg|thumb|right|[[Indicator]]s are not-spatial calculation models for summarized insights and results.]] | |||
{{main|Indicator}} | |||
[[Indicator]]s are definitions of statistical calculation models. Rather than the geographical calculation models which perform spatial calculations, [[Indicator]]s retrieve numerical values from the [[Session]]'s current state, can use those numerical values to perform calculations, and then output results. Those results are similarly not spatial, but can be numbers aggregated based on spatial features such as [[Neighborhood]]s or [[Area]]s. | |||
[[Indicator]]s are defined using uploaded [[Excel]] files. A number of [[Indicator]]s are offered directly through the {{software}} and can easily be added to any [[Project]]. It is also possible to create a custom [[Excel]] file with the appropriate linkage to the {{software}} and upload it, to define your own analyses or result overviews. | |||
[[Indicator]]s retrieve data from the {{software}} using [[TQL]], which is the [[Tygron Query Language]]. This is a syntax for instructions through which requests can be made of the {{software}} for certain details about the [[Session]], ranging from things like the surface area in a [[Neighborhood]], to the amount of market-rate housing units which are exposed to a specific level of [[Traffic Noise Overlay|Traffic Noise]]. | |||
[[Panel]]s are a similar type of data in the way they function, but they are not as visible by default and omit a score. | |||
{{clear}}{{page_break}} | |||
<!-- | |||
====Actions==== | |||
{{main|Action}} | |||
====Measures==== | |||
{{main|Measure}} | |||
====Scenarios==== | |||
{{main|Scenario}} | |||
--> | |||
===Recalculation mode=== | |||
Although working with calculation models has so far not yet come up, part of knowing how the {{software}} works includes a detail about automatic calculations. | |||
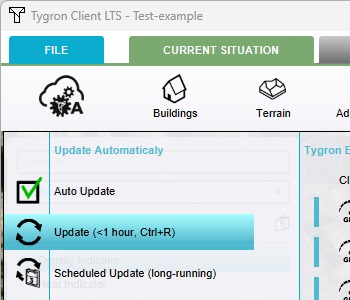
All options and information concerning overall calculation settings and status can be found in the recalculation menu. This menu is opened by hovering over the recalculation symbol at the top left of the interface. | |||
[[File:basics-editor-calculation-icon-auto.jpg|frame|center|The recalculation menu icon.]] | |||
One of the strengths of the {{software}} is that new data can be very easily analysed and recalculated. It is possible to recalculate a [[Session]] at any time by hovering over the recalculation symbol, and then clicking the "Update" option. | |||
[[File:basics-editor-calculation-update.jpg|frame|center|"Update" recalculates all models, such as [[Overlay]]s and [[Indicator]]s, in the [[Session]].]] | |||
{{page_break}} | |||
By default, [[Session]]s are set to recalculate automatically. This is signified by an "A" in the recalculation symbol in the top left of the editor interface. | |||
[[File:basics-editor-calculation-iconmenu-auto.jpg|frame|center|The "A" signifies the [[Session]] is set to recalculate automatically.]] | |||
While this symbol is present, auto-recalculate is active, and all dynamic calculation models are run automatically whenever any data in the [[Session]] changes. | |||
However, when the set of calculation models in a [[Session]] is such that recalculating takes a significant amount of time, the {{software}} will disable automatic recalculation. This will allow editing in the [[Session]] data without every change blocking work for a multitude of seconds. | |||
[[File:basics-editor-calculation-iconmenu-manual.jpg|frame|center|The symbol is faded, meaning there is no automatic recalculation.]] | |||
When the [[Session]] is not configured to recalculate automatically, newly added [[Grid Overlay]]s will be initialized with a value of "0" everywhere, and [[Indicator]]s and other computed interface elements will not updating or present as empty. | |||
When this happens, a recalculation of all calculation models in a [[Session]] can be triggered from the recalculation dropdown. | |||
{{page_break}} | |||
{{header|level=2|color=#c45911|Final assignments}} | |||
Using the information learned in this tutorial, and with an initial [[Project]] created specifically for experimentation, try the following editing actions and explore the results. | |||
# Hover over the Overlays button in the ribbon so that the dropdown opens. In the list of Overlay categories, select "Topographical", and then click on "Digital Terrain Model". Explore the resulting [[Digital Terrain Model Overlay]] | |||
# Hover over the Indicators button in the ribbon so that the dropdown opens. In the list of folders, select "Urban Planning", and then click on "Density". Explore the resulting indicator added in the [[top bar]]. | |||
{{Tutorial completed | |||
| learned=the basics of working with the {{software}} editor. This includes some general information about creating and managing [[Project]]s, and general navigation in [[Project]] data in the [[Editor]] | |||
| next= | |||
| next-topic= | |||
| notes= | |||
* [[Session]]s will be closed when you exit them explicitly by closing the application. However, should something happen which erroneously breaks connection, such as the computer losing power, the [[Session]] will remain active for a grace-period of {{timeout|keepalive=none}}. During this time the application can be restarted, and the session can be rejoined to continue without loss of work. | |||
}} | |||
Latest revision as of 09:25, 17 April 2024
Prerequisites
The following prerequisites should be met before starting this tutorial:
- This tutorial will take approximately 3 hours.
- Ensure your organisation's domain administrator has created an account for you. This must be an account with at least "EDITOR" rights.
- This tutorial will involve the creation of a new Project. This Project is intended for experimentation with the features the Tygron Platform offers.
Introduction to the Tygron Platform
The Tygron Platform is a server-client application specializing in rapid, parallel calculations and processing of data. Organizations have a license which allows access to the software, and a Domain which holds all the organization's User accounts and Projects. Each user within an organization that wishes to make use of the software must have an individual User account.
Projects are complete sets of data representing a use-case in a real geographical location. Projects can be started as a Session, which is an interactive representation of Project data. Generally, only one Session can exist per Project.
When a Session is active, it is generally not possible to start a second Session while the first Session is still running. However, it is possible for multiple Users to interact with the same Session at the same time.
This tutorial assumes a user account has been created with at least EDITOR rights.
Getting started as a new user
Download the Tygron Platform client application. It can be found here:
After the download completes, install it the application, and finally start the application.
If the Tygron Platform has not been run recently on this computer, a prompt may appear for the end-user license agreement. If you agree with the terms, accept it. Note that accepting the EULA is required to continue this tutorial and to use the Tygron Platform in general.
At the login screen, click on "forgot password". Enter the email associated with your account, and click on "Reset".
This will prompt an email to be sent to your email account with a new password, which will allow you to log in.
After resetting the password, the login screen will have reappeared. As username, enter your email. As password, enter the password sent to you in the mail. Then click on "sign in".
If the Tygron Platform has been freshly (re)installed, the application may take a moment to optimize its internal settings, so that it can maximize performance as necessary. This will force the application to close. When this happens, restart the application, and log in again.
The main menu will appear.
In the main menu, click on "options", and then "my account". This screen will allow you to manage your own account and your own Projects.
Click on "Change my password". A prompt will appear with which you can change your password to one you can remember.
Remember: do not share your password with anyone!
Working with Projects
Essential for working with the Tygron Platform is the ability to create new Projects and manage their Sessions and permissions.
Creating a project will require an account with at least EDITOR rights. If you do not see the options "Create new project" or "Edit existing project" in the main menu, contact your domain administrator to assign these rights to your account, as appropriate.
Creating a new Project
In the main menu, click on "Create new Project".
This will start the New Project Wizard.
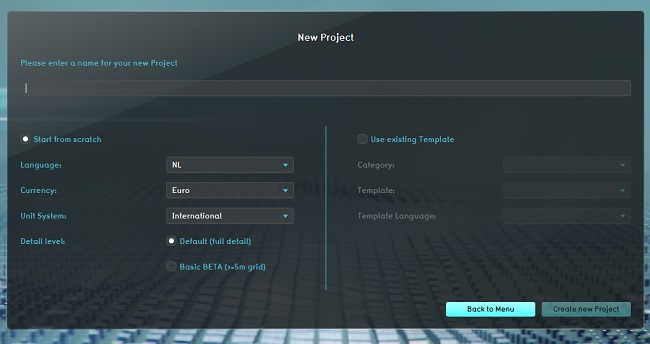
Enter a name for the new Project. A Project name should usually indicate the geographical setting where the Project is located. When creating a new Project for the purpose of experimentation, such as a tutorial, it is generally convention to have the project name indicate the person the Project belongs to, e.g. test-yourname.
The name must be between 3 and 20 characters, and may consist of alphanumeric characters, spaces, and dashes.
When creating a new Project, it is possible to either create a new Project from scratch, or to base the new Project on a pre-existing Project. Ensure the option for creating a new project is selected.
Set the Projects language to the desired language, the currency to the desired currency, and the measurement system to "international".
Proceed to the next screen of the wizard by clicking on "Create new Project".
This screen allows the selection of the geographical location and size of the new Project.
Use the search bar to locate the general area where the Project is to be located.
Move the map using the right-mouse button.
Use the left mouse button to place the blue selection zone in the appropriate location. Everything within the blue extent will be part of the Project and the 3D visualization. Anything outside the blue extent will not be part of the Project and the 3D visualization.
Click on "Advanced Options". This opens an additional panel in which some specific datasources can be toggled or configured. Some datasources can be explicitly includes or excluded from the process of generating the Project.
Disable the "Ownership" options. This will disable the Tygron Platform from generating a complex ownership situation, which might inhibit the free application of tools for sketching a future situation using Actions. Disabling the import of ownership data is a best-practice.
Click on "Generate". This will start the data import process on the Tygron Platform server.
After the generation process completes, the editor environment and 3D Visualization will load.
Saving, and permissions
When the Editor and the 3D Visualization have loaded, it is possible to explore the data present in the project, to effect changes in the data, to add calculation models, and perform all other operations desired.
Before exploring the editor, click on "File" in the top-left corner of the screen. This will open the File menu for the Project.
Click on "Save" to save the Project.
The current state of the Project will now be saved.
After the Project has saved, click on versions.
Each Project can have a maximum of 10 versions within it. Versions are used to create known states of a Project, to which it is possible to revert if so desired.
Click on "Add new version". This will save the current state of the Session in a second version. The second version will now be listed, and this new version will also be marked as active.
If changes are now made to the Project and the Project is saved, those changed will be stored in the new version. At any point in the future, it will be possible to revert the Project back to the initial "Base Version", which will not include those changes made in the second version.
It is important to note that the Tygron Platform does not have an "undo" button. To revert (complex) changes, the appropriate approach is to save periodically when the state of the Session is correct, using versions to maintain those states, and either closing without saving or switching to earlier versions to remove or revert the changes.
Click on "details". This will open the overview of general meta-data of the Project.
The meta data of a Project includes an overview of the permission which dictate who can access this Project and Session.
Permissions can be set for:
- Owner, which is generally the User whom created the Project
- Other users in Domain, which are all the Users in the same Domain
- Tygron Support, which is any Tygron employees
The rights for any of these can be set to any of the following levels:
- NONE, which means the Project cannot be accessed.
- READ, which means the Project can be opened as a Session. Data can be inspected and modified, but not saved. Saving a copy to create a new Project is allowed.
- WRITE, which means the Project can be saved as well, allowed its data to be permanently changed.
Note that any newly created Project (including one resulting from copying an existing Project), will have all rights except of that of the owner set to NONE. This is in line with Tygron's privacy-by-default policy, requiring explicit granting of access to others.
Also note that because the permissions for Tygron Support are set to NONE by default, Tygron employees cannot access a Project's data without explicit approval.
Closing and reopening
In the File menu, click on "Exit".
A prompt will appear to ensure you wish to exit, and whether the Project should be saved before closing. Opt to close the Session, either with or without saving.
The application will now close. The client application always closes fully when exiting a Session. Additionally, because there are no more Users active in the Session, the Session itself is also ended on the server. Because the Project has been saved manually before closing it, the Project data will continue to exist on the server even after the Session has closed.
Restart the application and log in again.
In the main menu, click on "options", and then "my account". Notice that now a Project is listed, specifically the Project created previously.
The permission settings, which could be edited from the Editor, can also be set from this overview.
Additionally, if at any point a Project should be reverted to a previous version, that can be done from this overview as well. Note that no Session of the Project may be running while changing the Project's version.
Finally, also take note of the option to delete any Project listed here.
Go back to the main menu, and click on "Edit Project".
The list of Projects includes:
- Projects created or owned by you.
- Projects from other Users in the same Domain which have their permissions set such that they are accessible for other users in the same Domain.
- Projects made globally available by Tygron, such as Demo projects
Select the Project created as part of this tutorial.
The Project will now open in a new Session, again providing an Editor environment in which it is possible to interact with the data.
Interacting with Project data
Sessions allow interacting with Project data, such that:
- The data present in the Project is made to be more representative of reality.
- Calculation models are added to analyse the data, resulting in information on a variety of theme's such as heat, water, and traffic effects.
- Tools for adding changes, from individual options for free-form drawing to complete urban plans which can be implemented integrally, are available for exploring and analyzing potential scenarios.
Structure of the editor
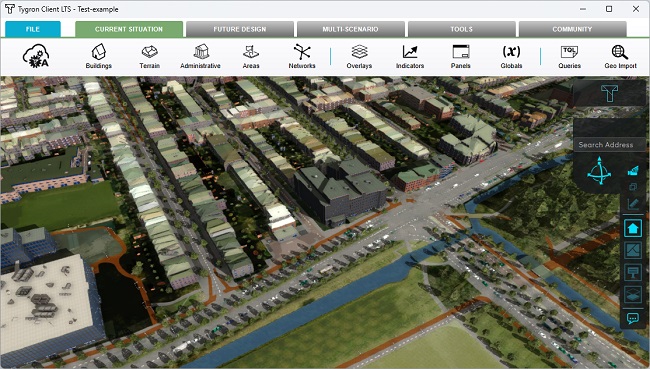
The editor can be considered to consist of 2 levels of interface:
- The 3D visualization and related user interface in the center of the screen, with mostly dark-colored interface elements.
- The surrounding/overlaid editing interface, with mostly bright-colored interface elements.
Exploring the 3D visualization
The 3D visualization is a visualization of the data in the Session, as a unified 3D world. All elements which can be seen in the 3D environment are based on data present in the Session.
Camera
The 3D visualization is facilitated through a camera, which has a position (the point at which the camera is located, and looking "from"), and a focal point (the point at which the camera is directed, and looking towards).
Click in the 3D world, and move the camera. Try the following motions:
- Hold down the left mouse button, and drag the 3D world, to move the camera along the horizontal plane.
- Hold down the right mouse button, and drag the 3D world, to rotate the camera around the point the camera is pointed at.
- Scroll the scroll wheel up and down to zoom in and out.
There are multiple camera modes available, which can be switched between. Find the camera icon at the top right side of the user interface.
Change the camera mode by clicking on the icon, and again try to move, rotate, and zoom the camera.
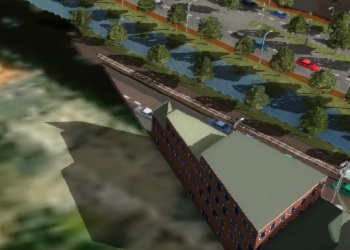
Move the focal point of the camera as far to the side as possible. Notice that when the edge of the Project area is reached, it is not possible to move any further. The camera is always directed at a location inside the Project area.
Overlays
On the right side of the screen, a list of icons is displayed. These icons represent Overlays, which are map layers which can be switched between. By default, the following Overlays are available:
| Icon | Overlay | Description |
|---|---|---|
| Base | Shows the 3D world as-is, without additional information. | |
| Neighborhood | The Neighborhoods the world is divided up into. | |
| Ownership | Shows what areas and what Buildings are owned by which Stakeholders. |
Click on the icons to switch between the Overlays. You will see the 3D Visualization now includes an additional overlaid image displaying specific information.
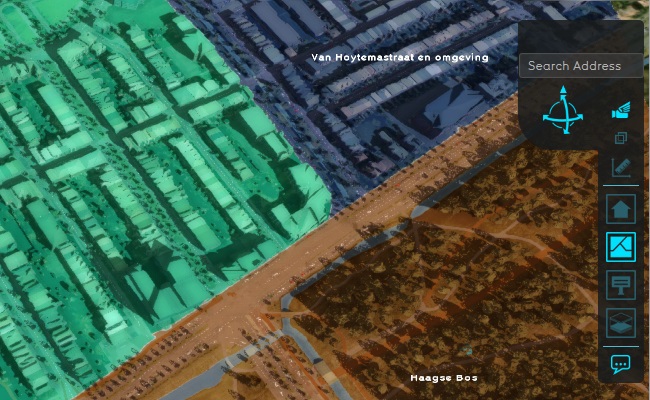
A legend is also displayed at the bottom of the user interface, clarifying the meaning of the colors of the Overlay.
Note that, because the "Ownership" option was turned off while creating this Project, there is no detailed ownership data available. The Ownership Overlay will still display the state of ownership of the data in the Project, but all land and Buildings are owned by the default Stakeholder, which is the municipality.
Select the base Overlay again, and click in any location in the 3D visualization. A hover panel will appear, giving more information about that location.
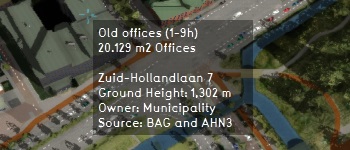
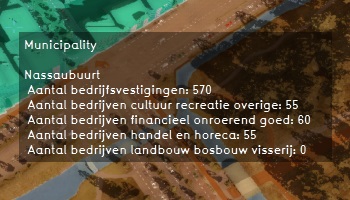
Switch to a different Overlay, and click in any location in the 3D visualization again. The hover panel will again appear. The hover panel and the active Overlay are always related, so the information displayed will always relate to the Overlay displayed.
Exploring the editor
Where the user interface allows for an integral look at the data via a 3D Visualization, the editing interface allows for inspecting and modifying all data, as well as access additional tools to further interact with the Session.
Ribbon tabs
All options in the editor are divided into groups of data and tools. The groups can be switched between using the tabs at the top of the ribbon. The tabs are:
- Current Situation, which defines all the base data of the Project, and the calculation models with which to analyse them.
- Future Design, which defines the tools which can be made available to explore potential future scenarios.
- Multi Scenario, which defines tools to set up and compare multiple future scenarios.
- Tools, miscellaneous tools, including recording tools, access to the API and web interface, and tools for Project templating.
- Community, which provides built-in links to other parts of the Tygron Platform ecosystem, such as the wiki for documentation, and the forum for users to exchange knowledge and ideas.
Switching between these tabs may also change parts of the user interface, allowing for more ways to view and interact with the 3D Visualization.
Starting out with the Tygron Platform, getting acquainted with, and properly using the options available which are part of the Current Situation are the essential foundation for each use-case. The functions available through the other tabs may be relevant for more specific or specialized use-cases.
Browsing data types
Ensure the "Current Situation" tab is selected.
Directly underneath the tabs in the ribbon is an overview of the data and tools which are relevant for the selected tab. In this case, the "Current Situation" provides access to data like the Buildings in the Project Area, terrain information such as elevation and Terrain Types, and the Overlays which can be viewed.
Click on "Buildings" (ignore the dropdown which appears). A left panel will appear in the editor, which provides an overview of all Buildings. The buildings are subdivided into categories (and Neighborhoods if there the amount of Buildings warrants it).
Click on "Overlays" (ignore the dropdown which appears). The left panel now lists all Overlays currently part of the Session. Notice that the Overlays listed in the left panel of the editing interface are the same as the Overlays listed on the right-hand side of the user interface.
Click on "Administrative" (ignore the dropdown which appears). The left panel now lists all Neighborhoods, which are the primary administrative subdivision of most Projects.
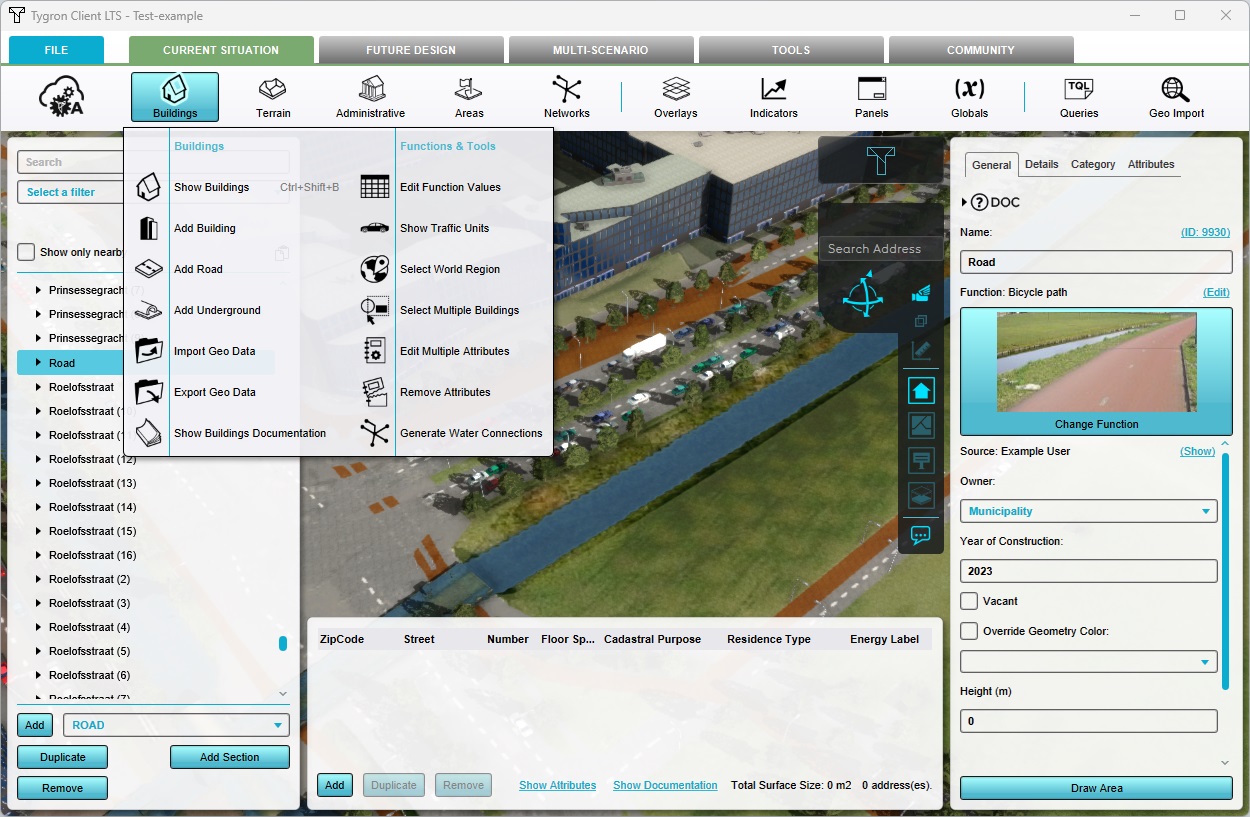
Hover over the "Buildings" button, and a dropdown will appear with further options.
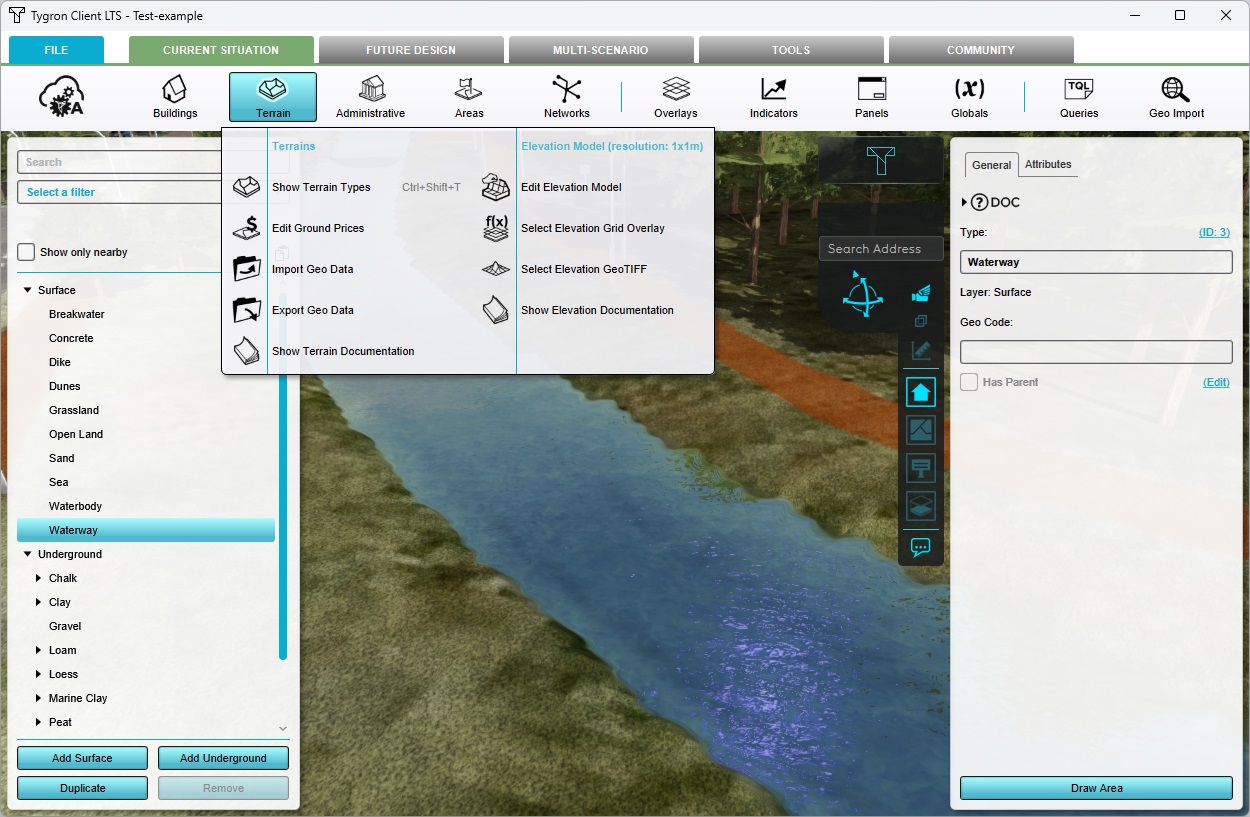
In general, dropdowns provide access to quick options for adding extra data of the specified type, options for data import- and export, access to related data such as typology, and access to documentation about that particular kind of data or feature. The exact contents are always dependent on the data or feature.
It is good to emphasize that, in order to view any kind of data, it is sufficient to click on the button of that data. In addition, each dropdown also has the option to show a list of that data, which has the same effect as clicking the button in the ribbon directly.
Inspecting specific data
Open the list of Buildings again. Select any Building in the list of Buildings. The right panel will display information about the specific Building selected.
Additionally, because a geopgraphic type of data was selected, the camera automatically moves so that the focal point is centered on selected Building, which is also highlighted to show where the Building is located.
For geographic types of data, it is also possible to click on the element in the 3D Visualization. Click on a road where cars are visualized, so that it is highlighted in the 3D Visualization and the right panel shows information about it.
This also works for roads (or other buildings) where no cars are shown, but for a later step it is most interesting to have a road with cars.
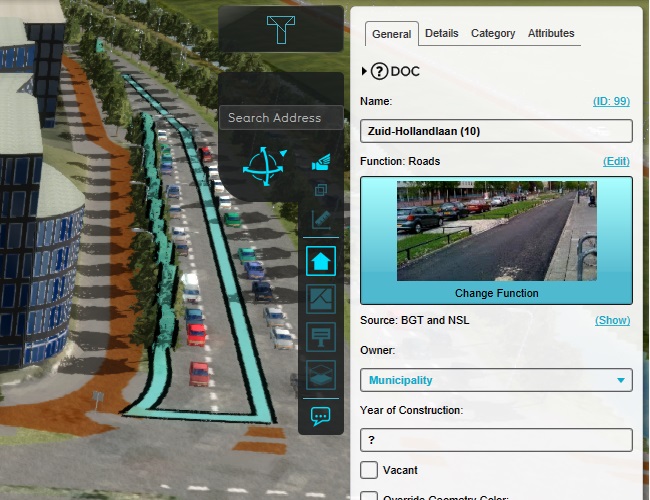
In the right panel, the individual properties of the road building can be viewed. Depending on the type of data, the exact layout of the right panel of the panel will vary. For Buildings, the right panel is divided into a number of tabs, with the General tab displaying some overall properties such as the name, the building type, and the owner.
The General tab also displays the source for the data. If the data was created during project generation, one or more sources will be listed from which the Tygron Platform has derived it.
Buildings also have properties divided into a Details tab and a Category tab. These tabs display a range of additional values for this Building, which in the case of Buildings are derived from their building type (In the Tygron Platform known as a Function).
Lastly, there is the Attributes tab. This tab displays Attributes, which are effectively miscellaneous properties the data has. In the case of a roads Building in a Project in the Netherlands, for example, an NWB_ID Attribute may be added to the Building, which is a national standard identification for roads allowing them to be easily related back to external datasources.
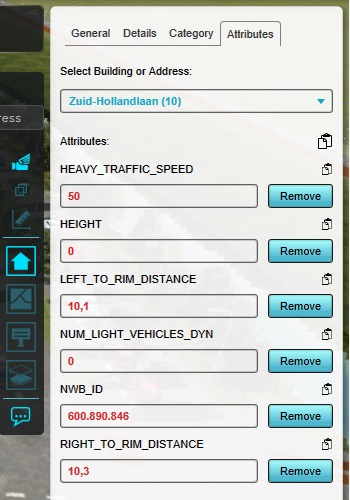
Attributes are a form of property related to many kinds of data, and can generally be used to hold any form of (custom) numeric value. working with Attributes is outside of the scope of this tutorial.
Changing data
Data in the right panel can also be easily changed. Switch to the General tab, and change the name of the road to "test road".
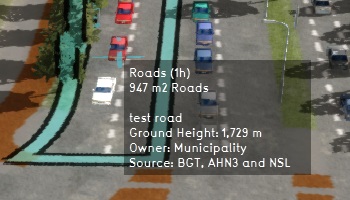
In the 3D Visualization, click on the road again so the hover panel appears. Notice the hover panel now displays the name "test road".
Switch to the Details tab, and find the "Cars / hour" value.
Note that it is easier to browse this particular overview by using the "Group Filter" option at the top to filter for only TRAFFIC-related values.
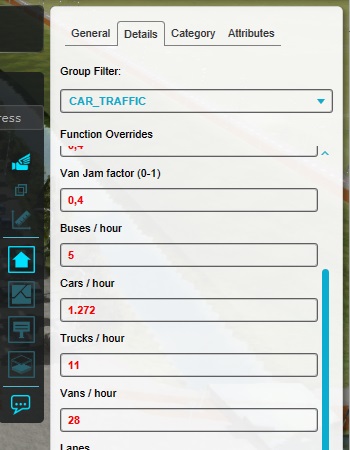
Some (or all) of the values are shown in black, and some values may be shown in red. Because the Building is of a certain Function (which is effectively a building type), values are derived from that function. However, some values may be known for this Building in particular. These are the values that are shown in red, which are values which are related to the actual Building itself, rather than being inherited from the type of building it is.
Change the "Cars / hour" value to a value 10 times as much.
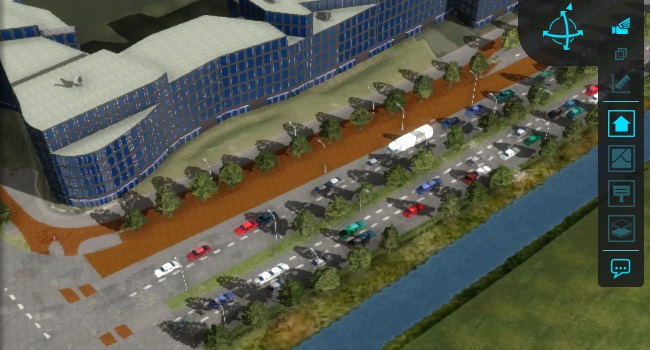
Notice the 3D Visualization now updates, and the amount of cars visualized on the road has increased significantly.
Adding and removing data
Data can also be added and removed entirely. In the left panel, ensure the "test road" building is selected. At the bottom of the left panel, click on "Remove".
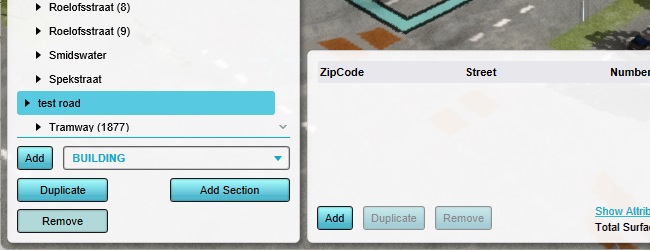
A prompt will appear to verify the building should be removed, and that the action cannot be undone. Confirm the action, and the Building will disappear from the 3D Visualization. The road is now removed from the Session.
The road is also visually removed from the 3D Visualization. A new Building (of the same or a different Function) can be added in its place.
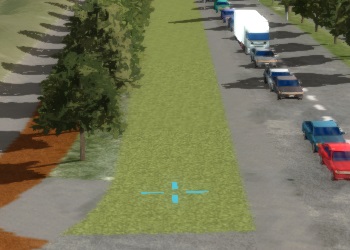
At the bottom of the screen, set the add-type dropdown to "ROAD", and click on "Add".
A new Building, named "Road", will now be listed in the left panel. It is automatically selected in the left panel, and details of it are displayed in the right panel.
Besides its default name, it is immediately assigned a Function as well.
Also take note of the "Source", which now lists you as the origin of the data.
Drawing data
This new Building exists in the Session data, but is not yet visualized. This is because the Building has not yet been assigned a location.
At the bottom of the right panel, click on "Draw Area".
The bottom panel will now present a number of selection drawing tools, and is known as the brush panel.

The 3D Visualization will also change, to show show where a selection can or cannot be drawn. Any place where the usual visualization can be seen is a valid location for a selection. Any place where a gray layer fades out the usual visualization is an invalid location for a selection.
For Buildings, the most common reason for locations being invalid to draw is because there is already a Building in that location. However, because a road was removed previously, a free location exists where the new Building can be drawn.
Left-click on one end of the free location where the new Building can be drawn. Then move the mouse so that a selection appears and extends across the intended location. When the selection is oriented appropriately, left-click again to place it.
Parts of the drawn selection may be green, and parts of the selection may be red. Do not worry about the red parts, they will be automatically ignored. Only the green parts of the drawn selection will actually be used.
A selection is now drawn in the 3D Visualization. In the bottom panel, click on "Apply selection". This will confirm that the selection which was drawn should be added to the polygons which compose the Building. This change to the Building also triggers an update of the 3D Visualization again, and the new road will appear.
Because the Building which was drawn is a road, the "selection type" in the brush panel was automatically configured as a line. Although a broader explanation about using all the option in the brush panel is not part of this tutorial, it is worth noting that the precise default selection type may differ for different types of data, but that it is almost always possible to switch between selecton types.
Essential data types
The Tygron Platform has a range of data types which can be added and/or edited in any given Session. Not all types of data are equally relevant for every use-case, but it is good to have a general overview of the kinds of data available and how they are generally structured.
For each type of data, a general description will be provided here. For more information on any specific data type, review the documentation available for those topics.
Buildings
- Main article: Building
Buildings have already been explored in a previous step, but are one of the most important types of data in any Project. Buildings are effectively all spatial features in any geographic extent. Among other things, all of the following are known as Buildings in the Tygron Platform:
- Houses
- Apartment complexes
- Offices
- Retail venues
- Roads
- Parking lots
- Trees
- Benches
- Crop fields
The most important notable exception is water, which is a type of Terrain.
Buildings inherit their properties from Functions, which can be considered the abstract building types. Each Building has the same properties as the Function it inherits from, unless that Building has values defined for it specifically.
Buildings can be seen in the 3D Visualization, with a model and textures which are defined by their Function.
Buildings consist of one or more sections. Buildings having sections allow for different parts of the same Building to have different amount of floors. This means that to set the floors for a Building, that property of the section(s) must be edited. Other than that, details about Buildings can be edited freely without looking at individual sections.
Terrains
- Main article: Terrain Type
Terrain is the definition of the surface and subsoil. Each location has both exactly one surface Terrain Type, and exactly one underground Terrain Type.
Terrain Types may inherit from other Terrain Types. Similar to Buildings, their properties are derived from the Terrain Types they inherit from, but can also have their own values set.
There is, effectively, no such thing as a Terrain to edit separately from a Terrain Type. Instead, Terrain Types are drawn directly into the Project Area.
Surface Terrain can be seen in the 3D Visualization, with a height defined by the elevation model, and a texture defined by the Terrain Type.
Underground Terrain can be visualized using an Underground Overlay.
Terrain also encompasses (and may refer to) the elevation model, also known as the terrain height.
Neighborhoods
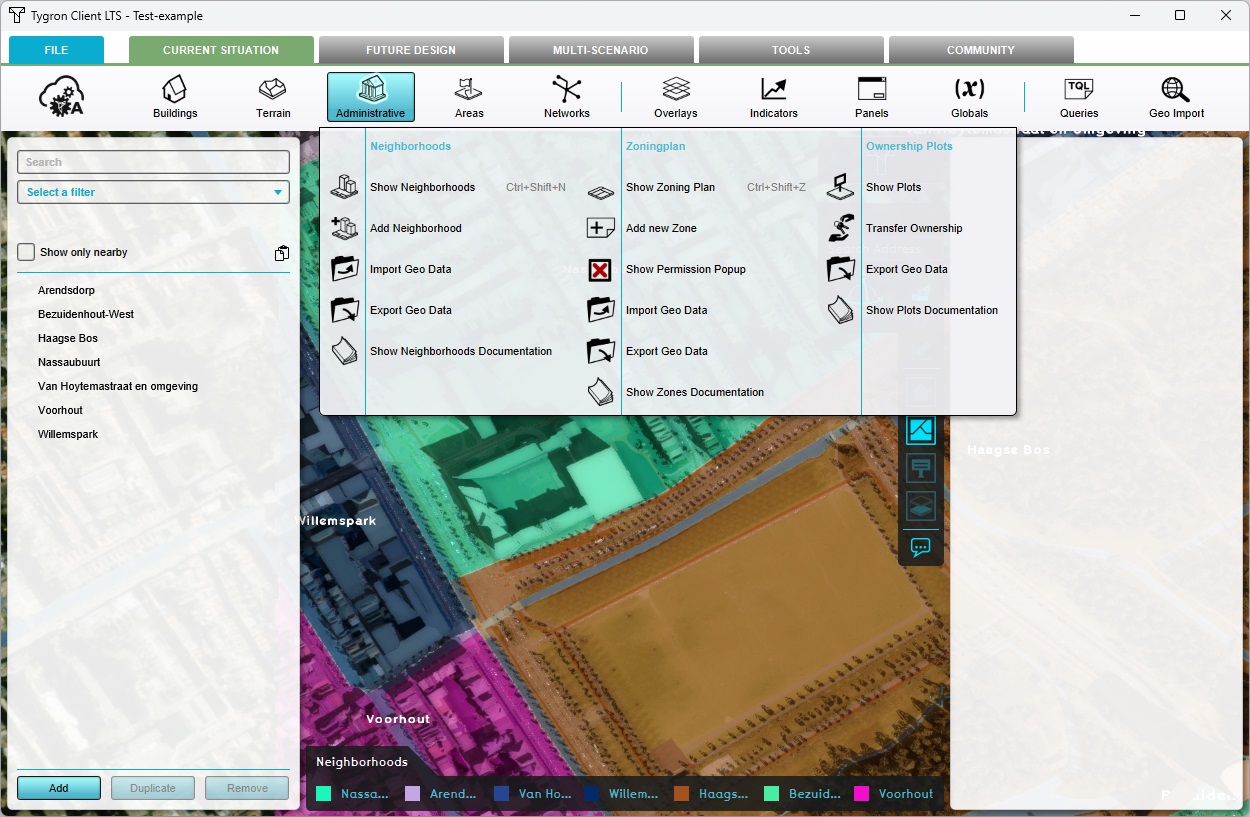
- Main article: Neighborhoods
Neighborhoods have already been briefly touched upon, but warrant some additional attention. Neighborhoods are administrative subdivisions. They are generally used as a default way to divide the Project Area up into smaller sections to aggregate results for, so that any results or changes become more manageable. In addition, for Projects in the Netherlands the CBS datasource will also provide a wide range of demographic attributes about the Neighborhoods when a new Project is generated.
Every location has at most one Neighborhood, and the entire Project Area should be covered by the complete set of known Neighborhoods. It is possible for a location to not be covered by a Neighborhood, but this is not a usual situation.
Neighborhoods can be visualized using a Neighborhoods Overlay.
Areas
- Main article: Area
Areas are a vague but useful datatype which can best be summarized as "arbitrary Polygons with Attributes". They are shapes which can be placed anywhere in the Project Area to represent data. They have no inherent meaning in the Tygron Platform, but can be used for any number of definitions which do not fit neatly into other categories of data provided. Some uses include:
- Indicating locations of spatial interest, such as archaeology of subsoil contamination
- Creating additional/alternative spatial subdivisions with which to calculate data or aggregate results, instead of on a Neighborhood level.
- Defining geographical policy areas for, for example, the Water Module. This includes Water Areas and Sewer areas.
- Defining geographical spatial features without affecting the Buildings layer, such as Foliage for the Heat Module.
Overlays
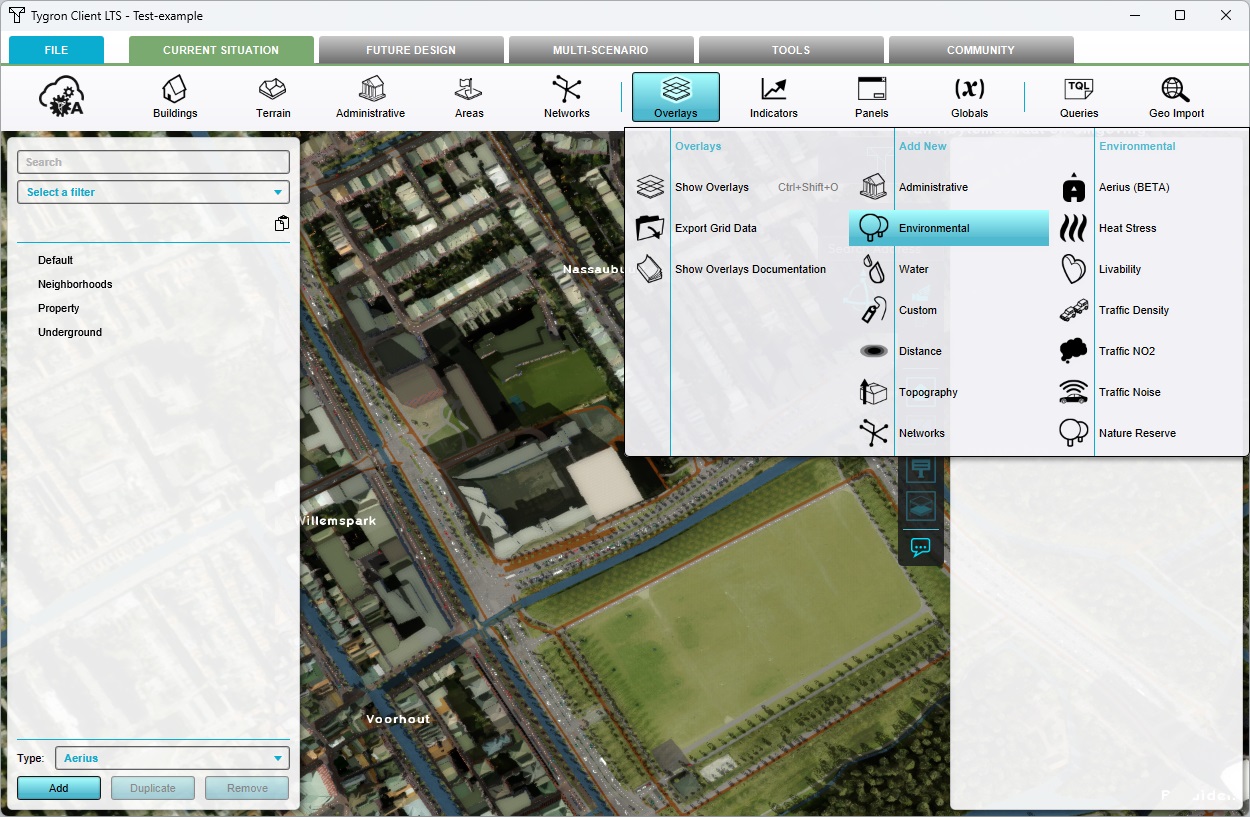
- Main article: Overlay
Overlayss have already been touched upon in a previous step, but are one of the most important types of data in any Project. As a first principle, they are map layers which display information already present in a Session, but which may not be directly visible in the 3D Visualization as is, such as the division of Neighborhoods.
Overlays can also perform spatial calculations. These Overlays are known as Grid Overlays, as they function by interpreting the Project area as a grid consisting of a large number of cells. A calculation is then run for every individual cell.
Some Grid Overlays are relatively simple, such as the Elevation Overlays or the Average Overlay. Other Grid Overlays are the practical implementations of fully-fledged calculation models, such as the Water Overlay or the Heat Overlay.
Overlays are a form of data which is part of the Session, but are not themselves geographical data in the Project Area. Instead they are definitions for available map layers and calculation models, the output of which are geographically visible.
Indicators
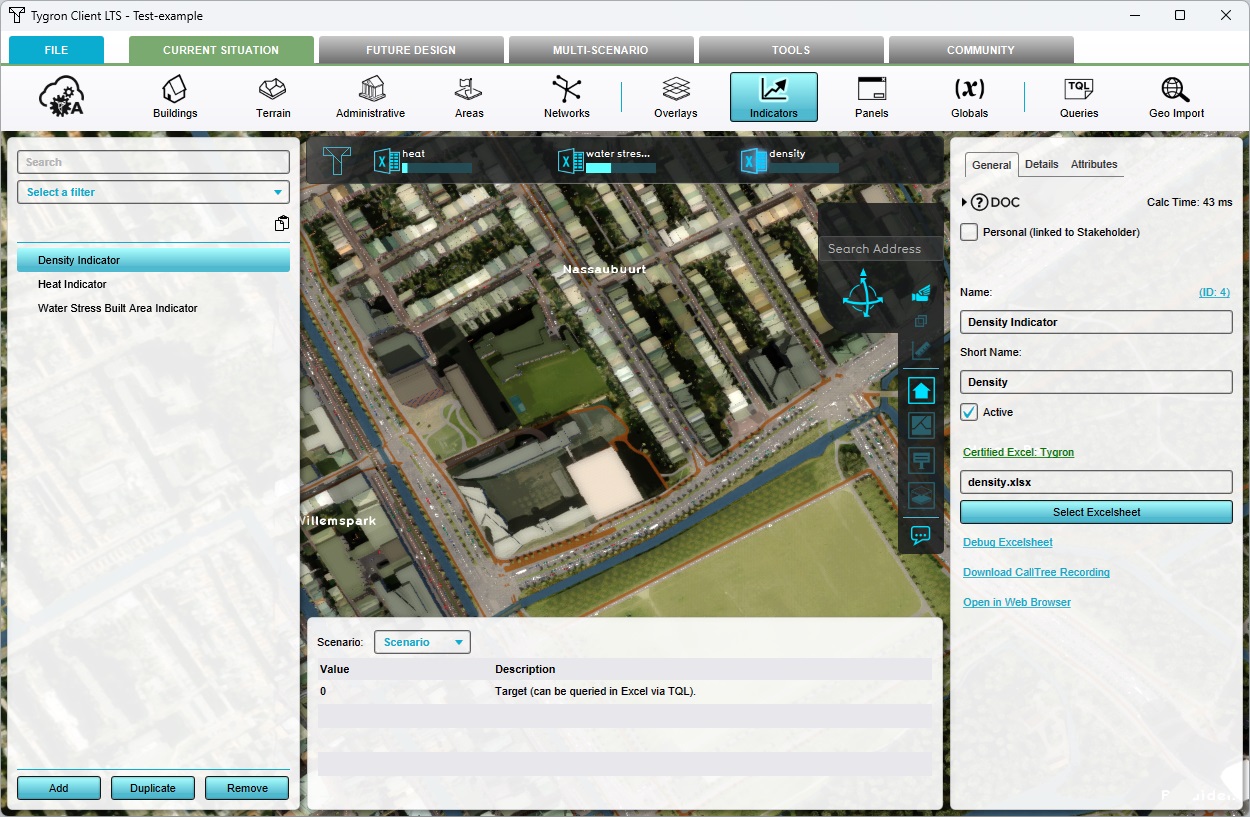
- Main article: Indicator
Indicators are definitions of statistical calculation models. Rather than the geographical calculation models which perform spatial calculations, Indicators retrieve numerical values from the Session's current state, can use those numerical values to perform calculations, and then output results. Those results are similarly not spatial, but can be numbers aggregated based on spatial features such as Neighborhoods or Areas.
Indicators are defined using uploaded Excel files. A number of Indicators are offered directly through the Tygron Platform and can easily be added to any Project. It is also possible to create a custom Excel file with the appropriate linkage to the Tygron Platform and upload it, to define your own analyses or result overviews.
Indicators retrieve data from the Tygron Platform using TQL, which is the Tygron Query Language. This is a syntax for instructions through which requests can be made of the Tygron Platform for certain details about the Session, ranging from things like the surface area in a Neighborhood, to the amount of market-rate housing units which are exposed to a specific level of Traffic Noise.
Panels are a similar type of data in the way they function, but they are not as visible by default and omit a score.
Recalculation mode
Although working with calculation models has so far not yet come up, part of knowing how the Tygron Platform works includes a detail about automatic calculations.
All options and information concerning overall calculation settings and status can be found in the recalculation menu. This menu is opened by hovering over the recalculation symbol at the top left of the interface.
One of the strengths of the Tygron Platform is that new data can be very easily analysed and recalculated. It is possible to recalculate a Session at any time by hovering over the recalculation symbol, and then clicking the "Update" option.
By default, Sessions are set to recalculate automatically. This is signified by an "A" in the recalculation symbol in the top left of the editor interface.
While this symbol is present, auto-recalculate is active, and all dynamic calculation models are run automatically whenever any data in the Session changes.
However, when the set of calculation models in a Session is such that recalculating takes a significant amount of time, the Tygron Platform will disable automatic recalculation. This will allow editing in the Session data without every change blocking work for a multitude of seconds.
When the Session is not configured to recalculate automatically, newly added Grid Overlays will be initialized with a value of "0" everywhere, and Indicators and other computed interface elements will not updating or present as empty.
When this happens, a recalculation of all calculation models in a Session can be triggered from the recalculation dropdown.
Final assignments
Using the information learned in this tutorial, and with an initial Project created specifically for experimentation, try the following editing actions and explore the results.
- Hover over the Overlays button in the ribbon so that the dropdown opens. In the list of Overlay categories, select "Topographical", and then click on "Digital Terrain Model". Explore the resulting Digital Terrain Model Overlay
- Hover over the Indicators button in the ribbon so that the dropdown opens. In the list of folders, select "Urban Planning", and then click on "Density". Explore the resulting indicator added in the top bar.
Final notes
Although not part of the general explanation provided in this tutorial, the following notes are important to keep in mind:
- Sessions will be closed when you exit them explicitly by closing the application. However, should something happen which erroneously breaks connection, such as the computer losing power, the Session will remain active for a grace-period of 30 minutes. During this time the application can be restarted, and the session can be rejoined to continue without loss of work.
Tutorial completed
Congratulations. You have now completed this tutorial. In it, you have learned the basics of working with the Tygron Platform editor. This includes some general information about creating and managing Projects, and general navigation in Project data in the Editor.
