Travel Distance Overlay
The Travel Distance Overlay is a grid overlay which shows a travel distance from a specific starting point (routing area). The traffic is split between motorized and pedestrian traffic, based on the road type (roads vs sidewalks). The overlay also uses a fill distance to fill up an area adjacent to the roadways, to connect constructions such as housing. The calculation model behind the overlay is based on the same algorithm as used in the Watershed Overlay.
The travel distance overlay can be used to visualise the travel distance from certain areas of interest (schools, shops, sports centers, etc), based on the road map in the project area. If we take a school as example, we can visualise which houses (and other buildings), within a range of 20m to a connecting sidewalk, are within a walking distance of 500m from the school of the example.
Keys
- ROUTING_AREA: Attribute required to setup the starting area from which to calculate the travel distance. The staring area needs to be drawn at the location of the object of interest and needs to overlap with all the adjacent connecting roadways for the selected traffic type (car and/or pedestrian).
- BLOCKED: Road with this attribute are ignored for travel. This can be used to simulate blocked roads for roadworks, street markets, etc.
Attributes
- TRAVEL_DISTANCE: Distance in M to travel. This is the maximum travel distance that is taken into consideration. E.g. the maximum range from a school/ shooping center/ fire station/ etc.
- FILL_DISTANCE: Fills up X meter adjacent to the road. E.g. houses that can be travelled to are max 20m away from the road.
- ROUTE_CARS: Select a value of 1 to have roadways that have Car traffic. Select 0 to ignore roadways with Car traffic.
- ROUTE_PEDESTRIANS: Select 1 to have roadways that have Pedestrian traffic. Select 0 to ignore roadways with Pedestrian traffic
Actions
| 1 | Click anywhere in the 3D world, and use the arrow keys on your keyboard to move around in the world. You can also drag the camera around by right-clicking (and holding the right mouse button down) in the 3D world and dragging the world around. Use the scroll wheel to zoom in- and out. | |
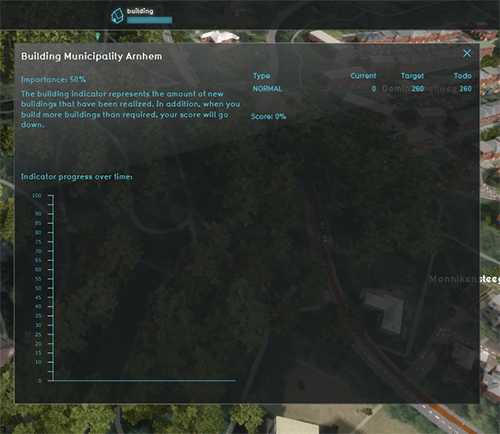
| 2 | At the top of the the session interface you can see the top bar. Click on any of the Indicators to open an indicator panel with information on how a score for the Project is determined.
The Green Indicator shows whether there is a sufficient amount of publicly available green space in a given area. Depending on the aspects of that location, the ratio should be anywhere from 10% to 60% to receive a minimum allowable score of 6. The default score (and maximum score) is 10. The Housing Indicator shows whether a sufficient amount of additional constructions have been planned, specifically housing. The target is set to 260 additional houses. |
|
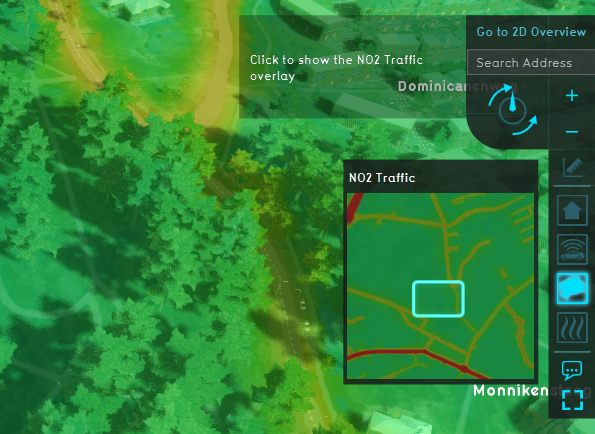
| 3 | On the right-hand side of the session interface you can see the overlays menu. Hover over the various icons to see a tooltip with their name. For demonstration purposes, there are a few Overlays available.
|
How-to's

