Aerius Overlay: Difference between revisions
Jump to navigation
Jump to search
No edit summary |
No edit summary |
||
| Line 3: | Line 3: | ||
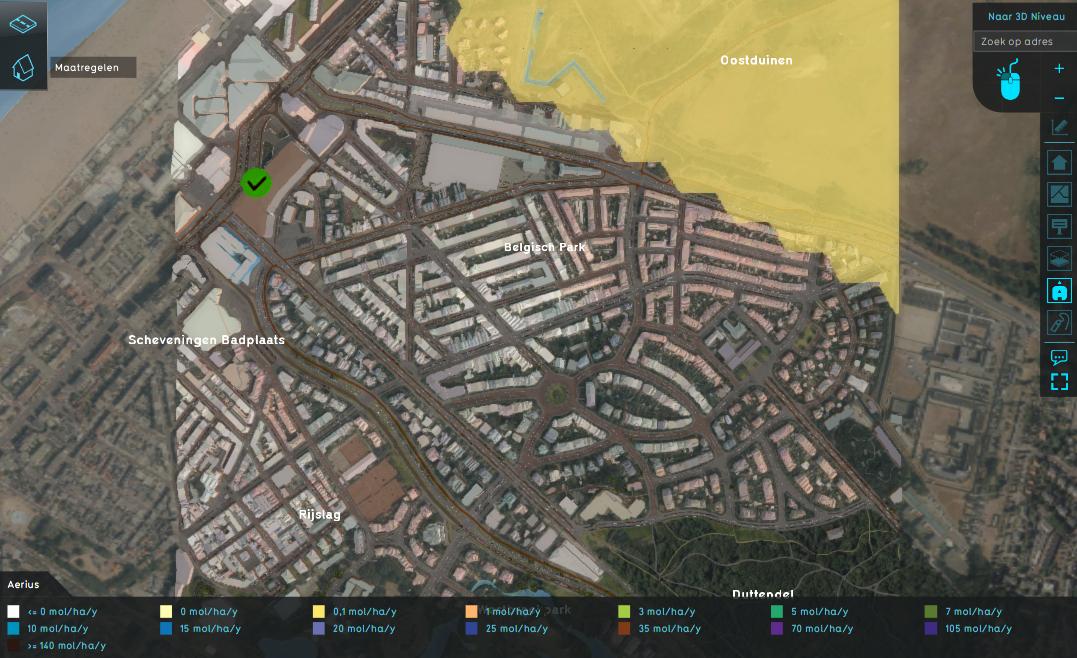
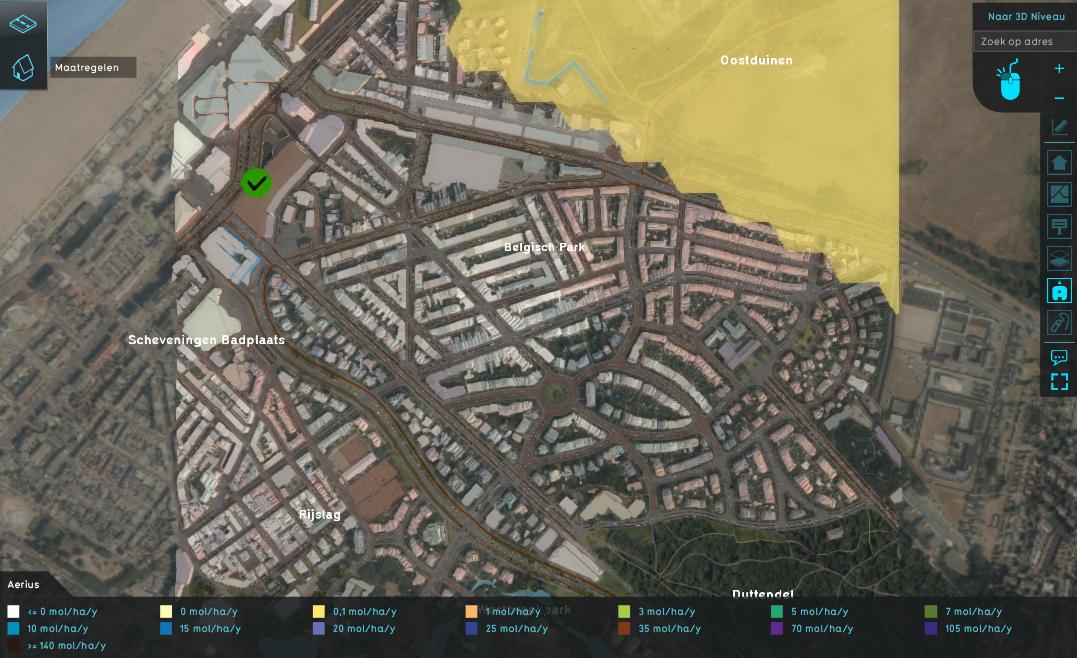
The Aerius overlay visualizes the NOX and NH3 deposition on Natura 2000 areas. | The Aerius overlay visualizes the NOX and NH3 deposition on Natura 2000 areas. | ||
See for more information the [[Aerius module overview|Aerius overview]]. <br> | See for more information the [[Aerius module overview|Aerius overview]]. <br> | ||
The Aerius results, including the entered values per emission source, can also be downloaded as a GML file. This file can then be uploaded in the | The Aerius results, including the entered values per emission source, can also be [[How_to_download_Aerius_results|downloaded]] as a GML file. This file can then be uploaded in the [https://calculator.aerius.nl/calculator/?locale=nl# Aerius Calculator]. | ||
[[File:nox_result_type.jpeg|thumb|420px|left|Example of the Aerius Overlay NOX result type]] | [[File:nox_result_type.jpeg|thumb|420px|left|Example of the Aerius Overlay NOX result type]] | ||
Revision as of 10:07, 12 January 2021
The Aerius Overlay shows the calculated results of the Aerius Module, which forms the connection between the Tygron Platform and the Aerius Calculator, version 2020.
The Aerius overlay visualizes the NOX and NH3 deposition on Natura 2000 areas.
See for more information the Aerius overview.
The Aerius results, including the entered values per emission source, can also be downloaded as a GML file. This file can then be uploaded in the Aerius Calculator.
Configuration
An Aerius Overlay can be configured by opening the Aerius Overlay Wizard.
Result types
| Icon | Result type | Unit | Mode | Description |
|---|---|---|---|---|
| |
NOX | mol/ha/year | The amount of NOX deposited in mol per hectare per year in Natura 2000 areas due to the supplied emission sources. | |
| |
NH3 | mol/ha/year | The amount of NH3 deposited in mol per hectare per year in Natura 2000 areas due to the supplied emission sources. |
How-to's


