Ownership Grid Overlay: Difference between revisions
Jump to navigation
Jump to search
No edit summary |
No edit summary |
||
| (4 intermediate revisions by the same user not shown) | |||
| Line 1: | Line 1: | ||
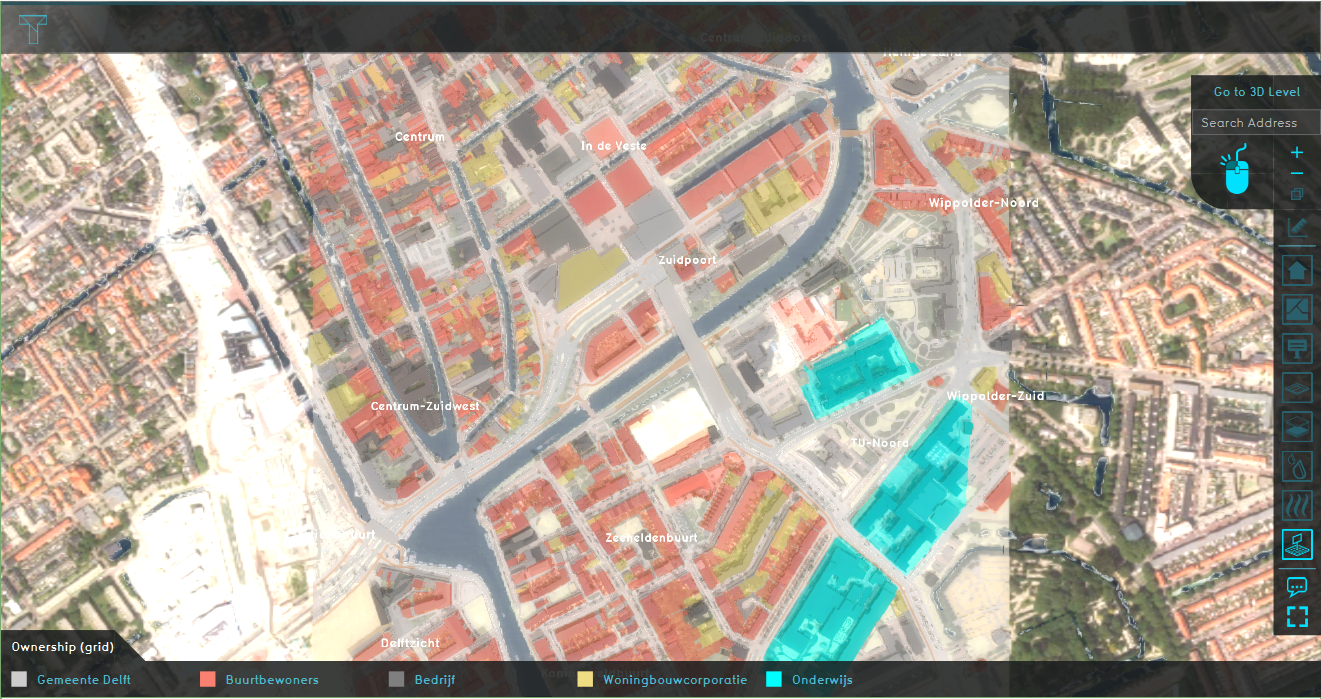
[[File:Ownership_grid.PNG|thumb|200px|right|Example of an Ownership Grid overlay]] | [[File:Ownership_grid.PNG|thumb|200px|right|Example of an Ownership Grid overlay]] | ||
The Ownership Grid | The [[Ownership Grid Overlay]] displays the [[ownership]] of [[Plot|plots]] across the project area, using the identification number of the [[Stakeholder]] owning the plot. The ownership ids are visualized using the color assigned to the corresponding [[Stakeholder]]. This Overlay is a [[Grid Overlay]] and is a rasterized version of the [[Ownership Overlay]]. This enables the use of ownership in [[Combo Overlay]]s and TQL Grid queries. | ||
<br clear=all> | <br clear=all> | ||
| Line 15: | Line 14: | ||
==Notes== | ==Notes== | ||
* Since this data is [[Geo_Data|Raster data]], the | * Since this data is [[Geo_Data|Raster data]], the cell values correspond with the [[ID]] of the [[Stakeholder]]. For example, if the Municipality has [[ID]] 0, then the cells in the Ownership Grid overlay with value 0 represent the property of the Municipality. | ||
* Since this is a [[Grid Overlay]], take note of the [[Grid_Overlay#Grid_size|grid cell size]] since this influences the accuracy of the Overlay. | * Since this is a [[Grid Overlay]], take note of the [[Grid_Overlay#Grid_size|grid cell size]], since this influences the accuracy of the Overlay. | ||
==See Also== | ==See Also== | ||
Latest revision as of 13:49, 28 September 2023
The Ownership Grid Overlay displays the ownership of plots across the project area, using the identification number of the Stakeholder owning the plot. The ownership ids are visualized using the color assigned to the corresponding Stakeholder. This Overlay is a Grid Overlay and is a rasterized version of the Ownership Overlay. This enables the use of ownership in Combo Overlays and TQL Grid queries.
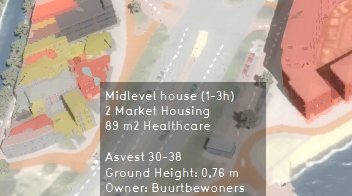
Additional information displayed in hover panel
When clicking on a specific location in the map, the hover panel gives additional information over the type of Function, amount of units or area size, the address, ground height and the owner.
How-to's
Notes
- Since this data is Raster data, the cell values correspond with the ID of the Stakeholder. For example, if the Municipality has ID 0, then the cells in the Ownership Grid overlay with value 0 represent the property of the Municipality.
- Since this is a Grid Overlay, take note of the grid cell size, since this influences the accuracy of the Overlay.
See Also

