Source Overlay: Difference between revisions
Jump to navigation
Jump to search
No edit summary |
|||
| (18 intermediate revisions by 3 users not shown) | |||
| Line 1: | Line 1: | ||
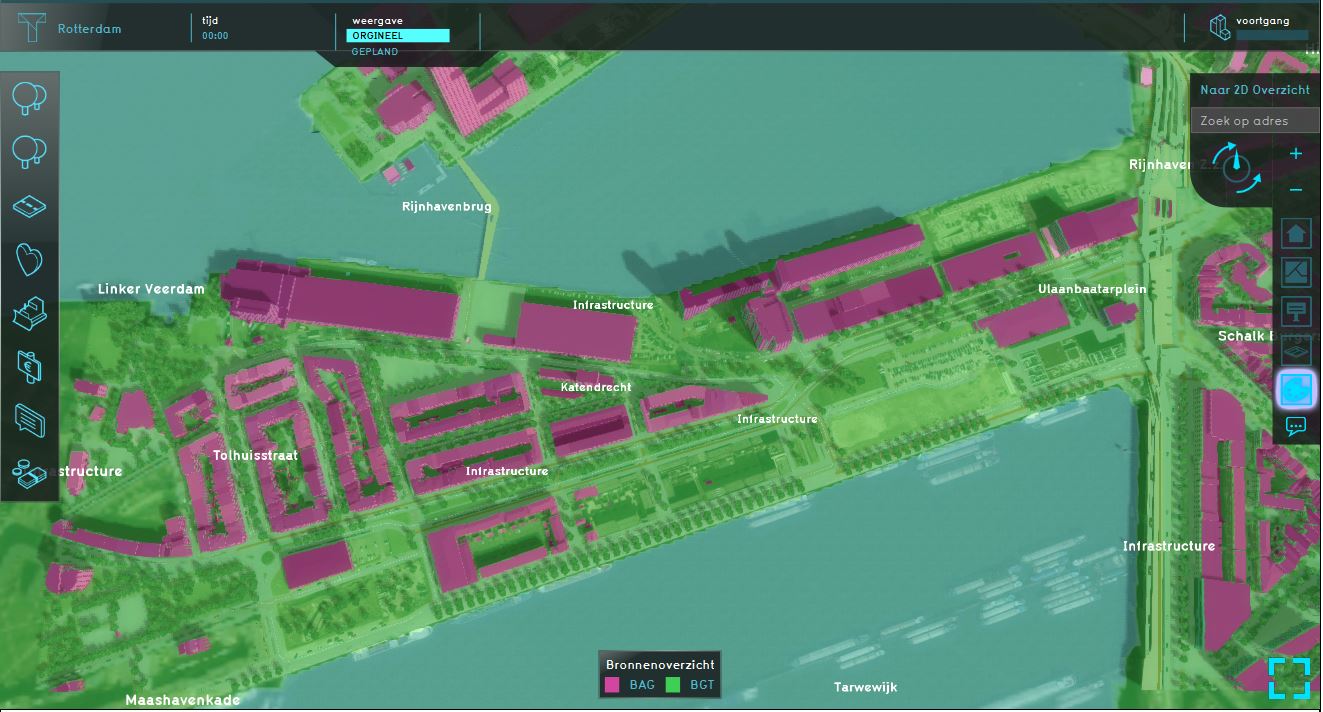
[[File:Source_overlay.JPG|thumb|200px|right|Example of a source overlay]] | |||
The source overlay is an [[Overlay]] which displays the datasets/sources that are used for generating the project. Additionally, datasets and sources imported by the [[Geo Data Wizard|Geo Data]] can be made visible in the source overlay.<br> | |||
At the right editor panel of this overlay, the datasets are listed that have been used for this project. These can be checked or unchecked to see where this dataset is used. <br> | |||
The source overlay is an [[Overlay]] which displays the datasets/sources that are used for generating the project. | This overlay becomes available for each stakeholder. | ||
<br clear=all> | <br clear=all> | ||
| Line 14: | Line 12: | ||
<br clear=all> | <br clear=all> | ||
== | ==How-to's== | ||
* [[How to add and remove an Overlay]] | |||
* [[How to edit an overlay legend|Edit an overlay legend]] | |||
==Notes== | |||
* When clicked on the ''Show Source Details'' link, a panel pops up which is the [[Project Sources]] Table. | |||
* When initially adding the source overlay, the overlay is white. | |||
==See Also== | |||
* [[GEO Data|Geo Data page]], for more information about the datasets that are used for generating a project. | |||
* [[Project Source]]s | |||
{{ | {{Template:Overlay nav}} | ||
Latest revision as of 16:48, 23 February 2023
The source overlay is an Overlay which displays the datasets/sources that are used for generating the project. Additionally, datasets and sources imported by the Geo Data can be made visible in the source overlay.
At the right editor panel of this overlay, the datasets are listed that have been used for this project. These can be checked or unchecked to see where this dataset is used.
This overlay becomes available for each stakeholder.
Additional information displayed in hover panel
When clicking on a specific location in the map, the hover panel gives additional information over all the datasets that are used/lie on that specific location.
These datasets/sources are also visible in the City overlay, when clicking on a specific location in the map.
How-to's
Notes
- When clicked on the Show Source Details link, a panel pops up which is the Project Sources Table.
- When initially adding the source overlay, the overlay is white.
See Also
- Geo Data page, for more information about the datasets that are used for generating a project.
- Project Sources

