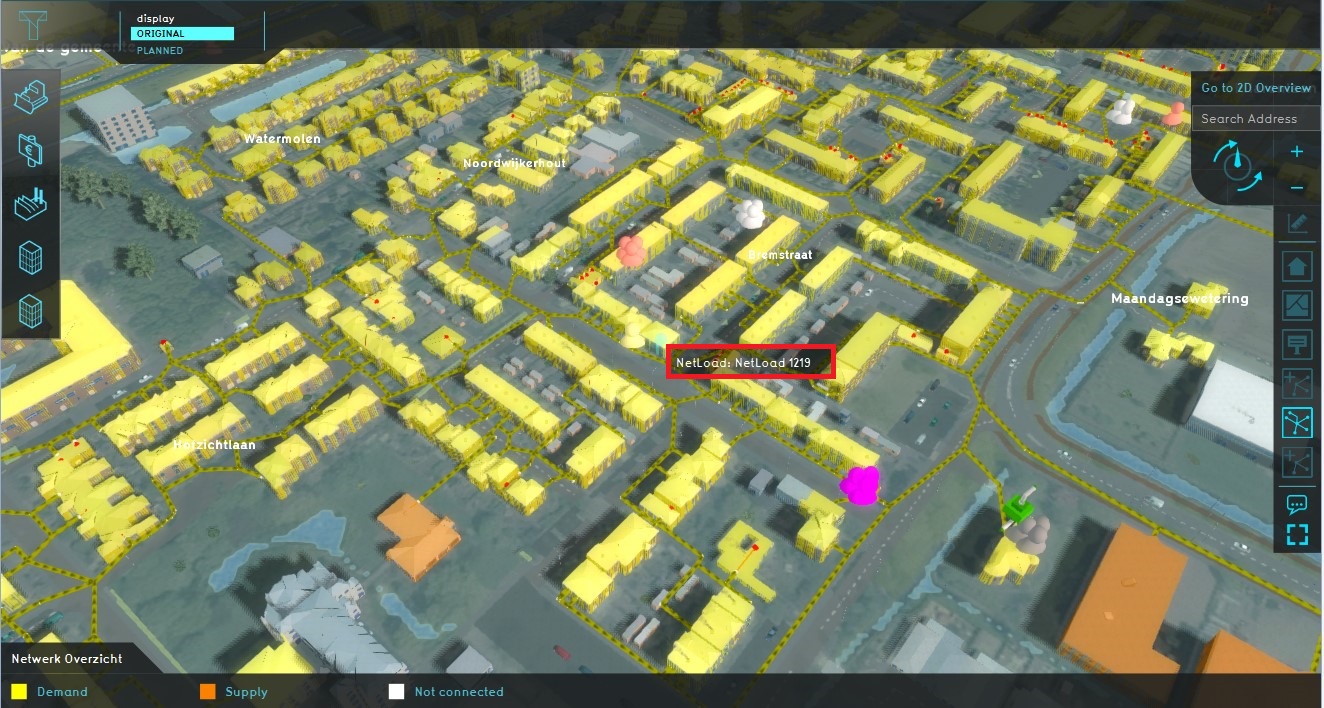
Network Overview Overlay
Revision as of 12:46, 8 September 2020 by Reijn@tygron.com (talk | contribs) (→Additional information displayed in hover panel)
Network Overview is an overlay that gives an insight into the Lines, loads and cluster topography of a network (electricity, gas, heat or internet). The coloured 3D Model shows the current activity of the networks connected buildings, there are three types of network activity. A net node connects a building to the grid via a net line, making it possible to distribute the Net load throughout the network. The network grid consists of two types of users: consumers and producers.
| Network Status | Color | Net Load |
|---|---|---|
| Demand | Yellow | Consumer |
| Supply | Orange | Producer |
| Not connected | White | No load |
Additional information displayed in hover panel
When clicking on a connected building on the map, the hover panel will show the Netload of the selected building.
How-to's
How to add and remove an Overlay
See also
