Average Overlay: Difference between revisions
Jump to navigation
Jump to search
No edit summary |
mNo edit summary |
||
| Line 1: | Line 1: | ||
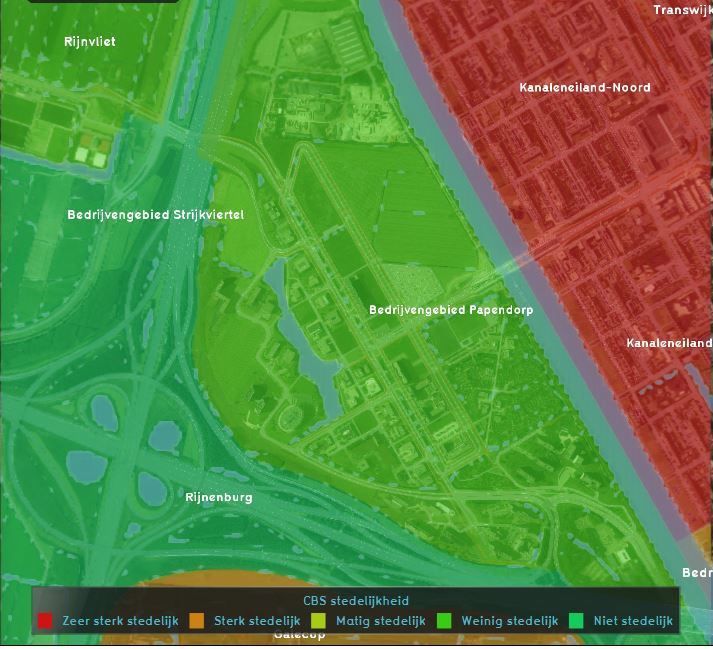
[[File:Average_overlay_example.JPG|thumb|250px|left|The Average Overlay of the urbanization attribute.]] | [[File:Average_overlay_example.JPG|thumb|250px|left|The Average Overlay of the urbanization attribute.]] | ||
The Average [[Grid overlay|(Grid) Overlay]] displays (smoothed) attribute values from buildings, terrains, areas or neighborhoods that are assigned to a grid cell. This overlay becomes available for each stakeholder. It is possible to create a custom dynamic [[Grid overlay|Grid Overlay]] with the Average Overlay. | The Average [[Grid overlay|(Grid) Overlay]] displays (smoothed) attribute values from buildings, terrains, areas or neighborhoods that are assigned to a grid cell. This overlay becomes available for each stakeholder. It is possible to create a custom dynamic [[Grid overlay|Grid Overlay]] with the Average Overlay. | ||
A typical use-case of the Average Overlay is to visualize parameters of a simulation model (e.g. the [[Rainfall _(Overlay)|rainfall overlay]]). A parameter assigned to a grid-cell can be related to one or more layers of the 3D model: [[Constructions|Buildings]], [[Terrains]], [[Areas]] and [[Neighborhoods]]. | |||
{{clear}} | |||
==Additional information displayed in hover panel== | ==Additional information displayed in hover panel== | ||
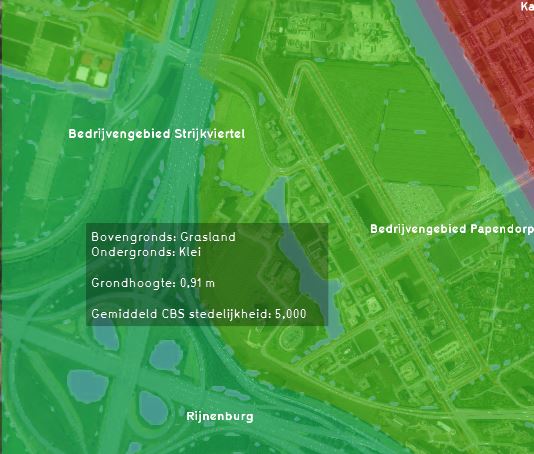
[[File:Average_hover_panel.JPG|thumb|250px|right|The Average Overlay of the urbanization attribute and additional information in the hover panel.]] | [[File:Average_hover_panel.JPG|thumb|250px|right|The Average Overlay of the urbanization attribute and additional information in the hover panel.]] | ||
When clicking on a specific location in the map of the Average Overlay, the hover panel gives additional information over the actual value in that specific grid cell. | When clicking on a specific location in the map of the Average Overlay, the hover panel gives additional information over the actual value in that specific grid cell. | ||
{{clear}} | |||
==How-to's== | ==How-to's== | ||
Revision as of 10:29, 14 February 2020
The Average (Grid) Overlay displays (smoothed) attribute values from buildings, terrains, areas or neighborhoods that are assigned to a grid cell. This overlay becomes available for each stakeholder. It is possible to create a custom dynamic Grid Overlay with the Average Overlay.
A typical use-case of the Average Overlay is to visualize parameters of a simulation model (e.g. the rainfall overlay). A parameter assigned to a grid-cell can be related to one or more layers of the 3D model: Buildings, Terrains, Areas and Neighborhoods.
Additional information displayed in hover panel
When clicking on a specific location in the map of the Average Overlay, the hover panel gives additional information over the actual value in that specific grid cell.
How-to's

