Average Overlay: Difference between revisions
No edit summary |
No edit summary |
||
| Line 1: | Line 1: | ||
{{being updated}} | {{being updated}} | ||
{{learned|what the Average overlay is|which additional information is displayed in the hover panel|how to add or remove the Average overlay}} | {{learned|what the Average overlay is|which additional information is displayed in the hover panel|how to add or remove the Average overlay}} | ||
====Average==== | |||
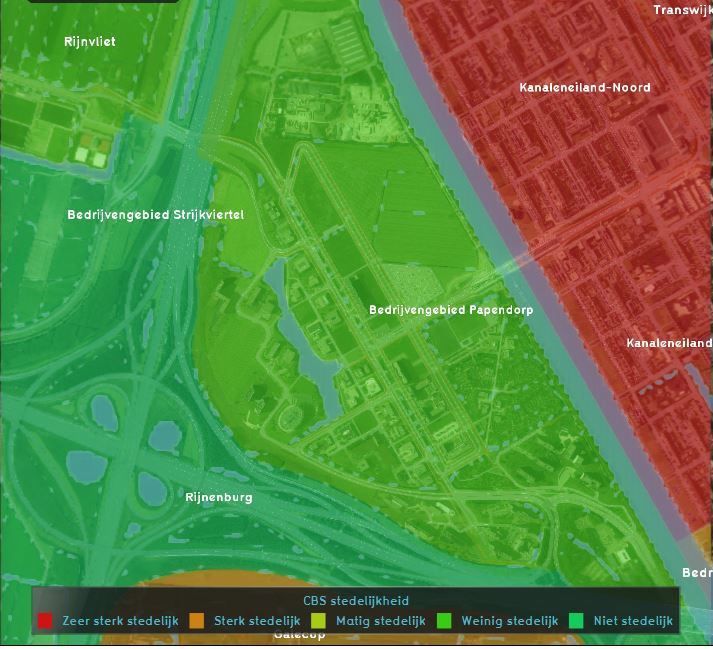
[[File:Average_overlay_example.JPG|thumb|left|The Average Overlay of the Urbanization attribute]] | |||
: ''Main article: [[Average Overlay]]. | |||
: ''The Average [[Grid overlay|Overlay]] displays an attribute value from a building, terrain, area or neighborhood assigned to a grid cell. This overlay becomes available for each stakeholder.'' | |||
<br clear=all> | |||
==What the Average Overlay is== | ==What the Average Overlay is== | ||
Revision as of 14:30, 2 April 2019
Average
- Main article: Average Overlay.
- The Average Overlay displays an attribute value from a building, terrain, area or neighborhood assigned to a grid cell. This overlay becomes available for each stakeholder.
What the Average Overlay is
The Average Overlay shows (smoothed) values of a grid cell. With the Average Overlay it is possible to create a custom dynamic Grid Overlay.
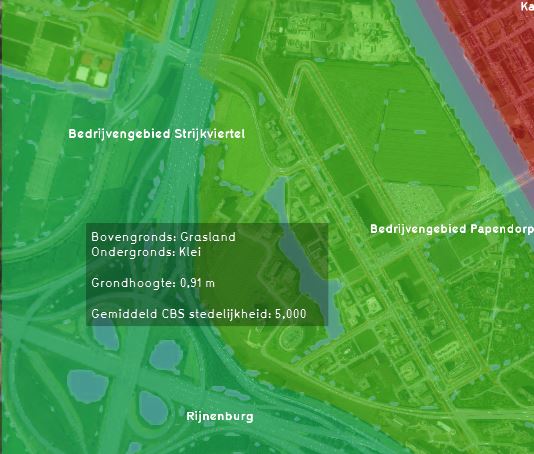
Additional information displayed in hover panel
When clicking on a specific location in the map of the Average Overlay, the hover panel gives additional information over the actual value in that specific grid cell.
Purpose of the Average Overlay
A typical use-case of the Average Overlay is to visualize parameters of a simulation model (e.g. the rainfall overlay). A parameter assigned to a grid-cell can be related to one or more layers of the 3D model: Buildings, Terrains, Areas and Neighborhoods.
Create an Average Overlay
- Select in the editor 'Geo Data' from the ribbon
- Select 'Overlays' from the ribbon bar
- Select the 'Add AVG' overlay
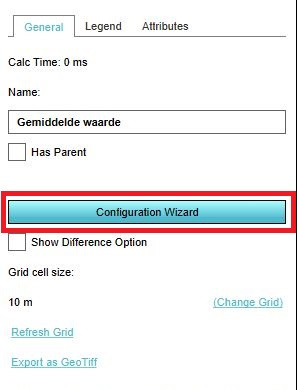
- Follow the steps in the configuration wizard (Average Overlay Wizard) in the panel on the right to set create the Average overlay
Average Overlay Wizard
Below an explanation of the steps in the Average Overlay Wizard.
Selection type
If you wish to create a spatial smooting, choose Create an average Grid Overlay, if you wish to Gain insight into Grid Cell Values, choose the latter option.
Select attribute value
Select the attribute from the list of all the attributes your project contains, you want to create an overlay from.
Select Layer
Attributes can be assigned to one of more layers in the 3D model: Buildings, Terrains, Areas and Neighborhoods. In this step you can select the following options for choosing which attribute values you would like to see:
- Filter occurrence in Layers: an attribute value is selected from order of occurrence in the model data layers mentioned above
- Minimum values in Layers. The minimum value is selected from all layers above
- Maximum values in Layers. The maximum value is selected from all layers above
- Specific Layer only. A specific layer can be selected.
Optional step: select distance
This step is optional and shows only when selected the create grid overlay option in step 1. in this step a smoothing distance value can be chosen.
After following these steps, you have created an Average Overlay. Perhaps it is an idea to also customize the legend of the overlay so that it is clear what you want to show with the overlay.
- Select in the editor 'Geo Data' from the ribbon
- Select 'Overlays' from the ribbon bar
- Select the desired overlay from the list of active overlays on the left panel
- Select 'remove' from the bottom of the left panel
- Confirm the removal in the pop up confirmation message


