Demo Parametric Project: Difference between revisions
mNo edit summary |
|||
| (70 intermediate revisions by 5 users not shown) | |||
| Line 3: | Line 3: | ||
| demographic=urban planners and zoning policy makers | | demographic=urban planners and zoning policy makers | ||
| showcases=how parametric designs can be used for rapid planning and prototyping | | showcases=how parametric designs can be used for rapid planning and prototyping | ||
| description=The demo is a project in which a location in The Netherlands has room for new urban development, and a number of [[Parametric Design]]s are prepared to allow for quickly designing entirely new urban areas. The project was originally created for a specific organization to test how the use of [[Parametric Design]] would affect their Indicators, but is publicly available for all users to experiment with. | | description=The demo is a project in which a location in The Netherlands has room for new urban development, and a number of [[Parametric Design]]s are prepared to allow for quickly designing entirely new urban areas. The project was originally created for a specific organization to test how the use of [[Parametric Design]] would affect their Indicators, but is now publicly available for all users to experiment with. | ||
| image=demo project parametric design.jpg | | image=demo project parametric design-v2.jpg | ||
}} | }} | ||
| Line 12: | Line 12: | ||
{| class="wikitable" | {| class="wikitable" | ||
|style="width: 5%"|1 | |style="width: 5%"|1 | ||
|style="width: 50%"|Click anywhere in the 3D | |style="width: 50%"|Click anywhere in the [[3D Visualization]], and use the arrow keys on your keyboard to move the [[Camera]] around. You can also move the camera with the mouse; See [[Camera#Standard]]. | ||
|style="width: 10%"| | |style="width: 10%"| | ||
|- | |- | ||
|style="width: 5%"|2 | |style="width: 5%"|2 | ||
|style="width: 50%"|At the top of the the [[ | |style="width: 50%"|At the top of the the [[viewer ]]interface you can see the [[top bar]]. Click on any of the [[Indicator]]s to open an [[indicator panel]] with information on how a score for the [[Project]] is determined. | ||
The [[Green MKP (Indicator)|Green Indicator]] shows whether there is a sufficient amount of publicly available green space in a given area. Depending on the aspects of that location, the ratio should be anywhere from 10% to 60% to receive a minimum allowable score of 6. The default score (and maximum score) is 10. | The [[Green MKP (Indicator)|Green Indicator]] shows whether there is a sufficient amount of publicly available green space in a given area. Depending on the aspects of that location, the ratio should be anywhere from 10% to 60% to receive a minimum allowable score of 6. The default score (and maximum score) is 10. | ||
The [[Housing (Indicator)|Housing Indicator]] shows whether a sufficient amount of additional constructions have been planned, specifically housing. The target is set to 260 additional houses. | The [[Housing (Indicator)|Housing Indicator]] shows whether a sufficient amount of additional constructions have been planned, specifically housing. The target is set to 260 additional houses. | ||
| Line 22: | Line 22: | ||
|- | |- | ||
|style="width: 5%"|3 | |style="width: 5%"|3 | ||
|style="width: 50%"|On the right-hand side of the [[ | |style="width: 50%"|On the right-hand side of the [[viewer ]]interface you can see the [[navigation panel]]. Hover over the various icons to see a tooltip with their name. For demonstration purposes, there are a few [[Overlay]]s available. | ||
* There is a [[Traffic Noise Overlay]], which automatically calculates spatially the amount of noise caused by traffic for any given location. | * There is a [[Traffic Noise Overlay]], which automatically calculates spatially the amount of noise caused by traffic for any given location. | ||
* There is a [[Traffic NO2 Overlay]], which automatically calculates spatially the amount of NO2 caused by traffic for any given location. | * There is a [[Traffic NO2 Overlay]], which automatically calculates spatially the amount of NO2 caused by traffic for any given location. | ||
| Line 30: | Line 30: | ||
==Point of interest== | ==Point of interest== | ||
The most important location in | The most important location in this [[project]] is on the western side of the project area. This is an empty location in which [[Parametric Design]] can be employed to create an additional residential area. There are few areas defined, indicated by the arrows, which have specific requirements to compute the [[Green MKP (Indicator)|Green Indicator]]. Other than that, and the small country roads dividing the areas, it's just empty space to build on. | ||
==Actions== | ==Actions== | ||
[[File:Editor ribbon bar testrun active.jpg|left]] | [[File:Editor ribbon bar testrun active.jpg|left]] | ||
The project is focussed on experimenting with options for Parametric Designs. Note that some actions may result in the start of a [[ | The project is focussed on experimenting with options for Parametric Designs. Note that some actions may result in the start of a [[Test_Run|test run]]. | ||
{{editor location|testrun}} | {{editor location|testrun}} | ||
This means the editing tools will be temporarily disabled. When you are done experimenting with actions, you can stop the testrun by clicking the stop button in the ribbon. This will revert the session back to its base state, without the effects of the applied action(s). | This means the editing tools will be temporarily disabled. When you are done experimenting with actions, you can stop the testrun by clicking the stop button in the ribbon. This will revert the session back to its base state, without the effects of the applied action(s). | ||
| Line 47: | Line 47: | ||
|- | |- | ||
|style="width: 5%"|2 | |style="width: 5%"|2 | ||
|style="width: 50%"|Select "Complete Urban Plan" in the list of designs. | |style="width: 50%"|Select "Complete Urban Plan" in the list of designs. The area of the plan is now highlighted in green. Select 'Generate Design' on the bottom right to continue. | ||
|style="width: 10%"|[[File:Parametric_design_demo_example_selected_1.jpg|thumb|center|300px|Area of a [[Parametric Design]] selected in the [[3D Visualization]].]] | |||
|- | |||
|style="width: 5%"|3 | |||
|style="width: 50%"|In the [[3D Visualization]] a colored representation of the planned design now appears. Sliders with details about this design are now available on the [[right panel]] of the editor display .<br> | |||
Take note of the following: | |||
* You will see the main structures are lined up along the pre-existing and the newly planned roads. | * You will see the main structures are lined up along the pre-existing and the newly planned roads. | ||
* You will see a number of bands along the roads, representing room for pavement and parking spaces. | * You will see a number of bands along the roads, representing room for pavement and parking spaces. | ||
* You will see in the center of the various blocks small ponds. | * You will see in the center of the various blocks small ponds. | ||
All of the features you see are automatically generated, based on parameters of the design (hence the name). | All of the features you see are automatically generated, based on parameters of the design (hence the name). | ||
|style="width: 10%"|[[File: | |style="width: 10%"|[[File:Parametric_design_demo_example_predefined_5.jpg|thumb|center|300px|A selected [[Parametric Design]] displayed in the [[3D Visualization]].]] | ||
|- | |- | ||
|style="width: 5%"| | |style="width: 5%"|4 | ||
|style="width: 50%"|In the [[bottom panel]], you will also see a pie chart and a number of statistics regarding the design as it currently stands. The statistics show how much space will be taken up by each feature. It additionally shows a percentage, indicating how much of the total area of the design that represents. The pie chart is a graphical representation of those percentages. Note that the sum of the percentages (and thus the pie chart) may not add up to 100%, indicating some of the design's space is left empty. | |style="width: 50%"|In the [[bottom panel]], you will also see a pie chart and a number of statistics regarding the design as it currently stands. The statistics show how much space will be taken up by each feature. It additionally shows a percentage, indicating how much of the total area of the design that represents. The pie chart is a graphical representation of those percentages. Note that the sum of the percentages (and thus the pie chart) may not add up to 100%, indicating some of the design's space is left empty. | ||
|style="width: 10%"|[[File: | |style="width: 10%"|[[File:Pie_chart_parametric_4.jpg|300px|center|thumb|]] | ||
|- | |- | ||
|style="width: 5%"| | |style="width: 5%"|5 | ||
|style="width: 50%"|At the bottom of the [[right panel]], click on "Apply Design". Note that a [[ | |style="width: 50%"|At the bottom of the [[right panel]], click on "Apply Design". Note that a [[Test_Run|test run]] will start; that's ok. You see a large amount of structures appearing in the [[3D Visualization]], matching the pattern previously displayed by the colored representation. | ||
|style="width: 10%"|[[File: | |style="width: 10%"|[[File:Parametric_design_demo_example_applied_5.jpg|thumb|center|300px|The applied [[Parametric Design]] displayed in the [[3D Visualization]].]] | ||
|- | |- | ||
|style="width: 5%"| | |style="width: 5%"|6 | ||
|style="width: 50%"|Note that the [[Indicator]]s in the [[top bar]] have changed as well. The average score for the [[Green MKP (Indicator)|Green Indicator]] has dropped from a 10 to | |style="width: 50%"|Note that the [[Indicator]]s in the [[top bar]] have changed as well. The average score for the [[Green MKP (Indicator)|Green Indicator]] has dropped from a 10 to 3. And if you click on the [[Indicator]] to see the scores per section of the planned area, you will even see that the scores for some areas have dropped even below that. | ||
|style="width: 10%"|[[File:Green_indicator_panel_parametric_3.jpg|300px|center|thumb|]] | |style="width: 10%"|[[File:Green_indicator_panel_parametric_3.jpg|300px|center|thumb|]] | ||
|- | |- | ||
|style="width: 5%"| | |style="width: 5%"|7 | ||
|style="width: 50%"|At the bottom of the [[right panel]] of the [[Indicator]], select "Revert Last Design". You will see the structures disappear from the [[3D | |style="width: 50%"|At the bottom of the [[right panel]] of the [[Indicator]], select "Revert Last Design". You will see the structures disappear from the [[3D Visualization]]. The plan is now undone. | ||
|style="width: 10%"|[[File: | |style="width: 10%"|[[File:Revert_last_design4.jpg|300px|center|thumb|]] | ||
|} | |} | ||
| Line 78: | Line 83: | ||
|style="width: 50%"|You can change the parameters of a design, so that the structure of the result better fits the needs of the surrounding use-case. In this case, to make the [[Green MKP (Indicator)|Green Indicator]] score better, the ratio of publically available green should be improved. More space should be unoccupied. | |style="width: 50%"|You can change the parameters of a design, so that the structure of the result better fits the needs of the surrounding use-case. In this case, to make the [[Green MKP (Indicator)|Green Indicator]] score better, the ratio of publically available green should be improved. More space should be unoccupied. | ||
Ensure the "Complete Urban Plan" design is (still) selected, and take note of the parameters displayed in the [[right panel]]. There are many of them, because there are also many elements part of the design. | Ensure the "Complete Urban Plan" design is (still) selected, and take note of the parameters displayed in the [[right panel]]. There are many of them, because there are also many elements part of the design. | ||
|style="width: 10%"|[[File: | |style="width: 10%"|[[File:Parametric_design_right_panel5a.jpg|200px|center|thumb|]] | ||
|- | |- | ||
<!-- | |||
|style="width: 5%"|2 | |style="width: 5%"|2 | ||
|style="width: 50%"|Find the parameter for the "Road between distance". This parameters indicates the maximum amount of distance which may exist between two roads. If the distance would be greater than this amount, an additional road is added. This causes the blocks of houses to become smaller, as the total area is divided into more and more smaller sections, leaving less internal space to be open and green. Set this parameter to 80 meters. | |style="width: 50%"|Find the parameter for the "Road between distance". This parameters indicates the maximum amount of distance which may exist between two roads. If the distance would be greater than this amount, an additional road is added. This causes the blocks of houses to become smaller, as the total area is divided into more and more smaller sections, leaving less internal space to be open and green. Set this parameter to 80 meters. | ||
| Line 88: | Line 94: | ||
|style="width: 10%"|[[File:Parametric design demo example tweaked 2.jpg|center|Change the "Main road distance" parameter of the [[Parametric Design]].]] | |style="width: 10%"|[[File:Parametric design demo example tweaked 2.jpg|center|Change the "Main road distance" parameter of the [[Parametric Design]].]] | ||
|- | |- | ||
|style="width: 5%"| | --> | ||
|style="width: 50%"| | |style="width: 5%"|2 | ||
|style="width: 10%"|[[File: | |style="width: 50%"|Find the "Water percentage". This parameter indicates how much water should be added, starting from the center of each block of plots. Given that for the [[Green MKP (Indicator)|Green Indicator]] the amount of open land should be maximized, any amount of water would effectively be a waste. Set this parameter to 0%. | ||
|style="width: 10%"|[[File:Parametric_design_right_panel5d.jpg|center|Change the "Water percentage" parameter of the [[Parametric Design]].]] | |||
|- | |- | ||
|style="width: 5%"| | |style="width: 5%"|3 | ||
|style="width: 50%"|As these changes were made, the colored representation of the [[Parametric Design]] in the [[3D | |style="width: 50%"|As these changes were made, the colored representation of the [[Parametric Design]] in the [[3D Visualization]] has changed along with it, determining a new layout based on the now changed parameters. | ||
|style="width: 10%"|[[File:Parametric design demo example tweaked | |style="width: 10%"|[[File:Parametric design demo example tweaked 4b.jpg|thumb|center|300px|The representation of the tweaked [[Parametric Design]] in the [[3D Visualization]].]] | ||
|- | |- | ||
|style="width: 5%"| | |style="width: 5%"|4 | ||
|style="width: 50%"|Click on "Apply Design" again, and new structures will appear in the [[3D | |style="width: 50%"|Click on "Apply Design" again, and new structures will appear in the [[3D Visualization]]. The road layout is subtly different, and no ponds have been created. The [[Green MKP (Indicator)|Green Indicator]] in the [[top bar]] now also shows an average score of 7, which is an obvious improvement over the previous design's score of 6. Click on it, and you will see that some areas still score below a 6, and thus are not up to scratch, but a step has been made in the right direction, compared to the original plan. | ||
|style="width: 10%"|[[File: | |style="width: 10%"|[[File:ApplyParaDesignBtn1.jpg|thumb|center|300px]] | ||
|} | |} | ||
| Line 108: | Line 114: | ||
{| class="wikitable" | {| class="wikitable" | ||
|style="width: 5%"|1 | |style="width: 5%"|1 | ||
|style="width: 50%"|Other than creating and tweaking a pre-existing design, it is of course also possible to create a completely new [[Parametric Design]]. First, make sure the [[ | |style="width: 50%"|Other than creating and tweaking a pre-existing design, it is of course also possible to create a completely new [[Parametric Design]]. First, make sure the [[Test_Run|test run]] is stopped. | ||
|style="width: 10%"|[[File: | |style="width: 10%"|[[File:Stop_Test_Run_btn1.jpg|200px|center|thumb|]] | ||
|- | |- | ||
|style="width: 5%"|2 | |style="width: 5%"|2 | ||
|style="width: 50%"| | |style="width: 50%"|Ensure the list of [[Parametric Design]]s is opened in the [[left panel]], then click on "Add" at the bottom of the [[left panel]]. This adds a new [[Parametric Design]]. | ||
|style="width: 10%"| | |style="width: 10%"|[[File:Add_parametric_design_btn1.jpg|200px|center|thumb|]] | ||
|- | |- | ||
|style="width: 5%"|3 | |style="width: 5%"|3 | ||
|style="width: 50%"| | |style="width: 50%"|Select the newly created design and the [[right panel]] will display the properties of the new [[Parametric Design]]. A new design initially has default elements and values set. By clicking on the blue "Edit" links, you can select a new type of element for the default selection. The red lines on the sliders indicate the maximun value for a function in relation to the other functions. When you move one slider to the left, the red lines on the other sliders will move to the right, showing the space created by lowering one parameter. It is not possible to move a slider to the right of the red line. Only after lowering another parameter, can the maximum of a selected parameter be moved up. | ||
|style="width: 10%"|[[File: | |style="width: 10%"|[[File:Parametric_design_right_panel5a.jpg|200px|center|thumb|]] | ||
|- | |- | ||
|style="width: 5%"|4 | |style="width: 5%"|4 | ||
|style="width: 50%"|At the | |style="width: 50%"|At the bottom of the [[right panel]], click on "Draw Area". This will allow you to assign a location to the design. Use the [[brush]] to draw where the design should be applied to. Select the polygon of the Northern Plot, and of the Elongated Area on the east side of the relevant area. This is easiest to do with either the "polygon pick" selection mode or the "blueprint" selection mode. You can also use a different selection type if you find another one easier. However, ensure that the resulting selection is attached to or overlaps with an existing road. Click on "Apply selection" button to save the selection as the [[Parametric Design]]'s location. | ||
|style="width: 10%"|[[File: | |style="width: 10%"|[[File:Parametric_design_demo_example_created-2.jpg|thumb|center|300px|Draw the new [[Parametric Design]] on these locations in the [[3D Visualization]].]] | ||
|- | |- | ||
|style="width: 5%"|5 | |style="width: 5%"|5 | ||
|style="width: 50%"| | |style="width: 50%"|At the top of the [[right panel]], switch to the "Plots" tab. This shows the list of [[Function|functions]] defined for the various plots a [[Parametric Design]] contains. By default one functions is selected as a starting point, but more can be added to fit the project with the "Add Function" button. You can see this in effect in the 'Mixed' plans that are available for all areas. | ||
|style="width: 10%"|[[File: | |style="width: 10%"|[[File:Parametric_design_right_panel5b.jpg|200px|center|thumb|]] | ||
|- | |- | ||
|style="width: 5%"|6 | |style="width: 5%"|6 | ||
|style="width: 50%"| | |style="width: 50%"|Switch to the "Road" tab, and click on the blue "Roads" link to open the [[Function]] selection window. Here you can select which [[Function]] you would like to use as a road in your parametric Design. You can also select a different function type for the sidewalk. The entry fields let you adjust the width and other related values of the road, sidewalk and adjacent parking spaces. These settings all impact the amount and placement of the road function. Feel free to experiment with these. | ||
|style="width: 10%"|[[File: | |style="width: 10%"|[[File:Parametric_design_right_panel5c.jpg|200px|center|thumb|]] | ||
|- | |- | ||
|style="width: 5%"|7 | |style="width: 5%"|7 | ||
|style="width: 50%"| | |style="width: 50%"|When ready, click on the 'Generate Design' button. | ||
|style="width: 10%"|[[File:Parametric_design_right_panel5e.jpg|200px|center|thumb|]] | |||
|style="width: 10%"|[[File: | |- | ||
|style="width: 5%"|8 | |||
|style="width: 50%"|Now the platform has calculated the most optimal placement of the parametric design. You can still adjust the parameters and generate the re-design again. | |||
|style="width: 10%"|[[File:Parametric design demo example created 3.jpg|thumb|center|300px|The new [[Parametric Design]] with plots and roads.]] | |||
|- | |||
|style="width: 5%"|9 | |||
|style="width: 50%"|When the plan is finalized, you can select 'Apply Design'. | |||
|style="width: 10%"|[[File:ApplyParaDesignBtn1.jpg|200px|center|thumb|Apply Design button]] | |||
|- | |||
|style="width: 5%"|10 | |||
|style="width: 50%"|A test run is started, while the plan is being applied and displayed in the [[3D Visualization]]. Effect on indicators and overlays is calculated. | |||
|style="width: 10%"|[[File:ParaDesign_Demo_applied-2.jpg|300px|center|thumb|The new [[Parametric Design]] with plots and roads applied and visualized.]] | |||
|} | |} | ||
| Line 143: | Line 160: | ||
{| class="wikitable" | {| class="wikitable" | ||
|style="width: 5%"|1 | |style="width: 5%"|1 | ||
|style="width: 50%"|Rather than looking only at a single parameterized design, it is possible to combine separate multiple designs. A design is applied | |style="width: 50%"|Rather than looking only at a single parameterized design, it is possible to combine separate multiple designs. A design is applied to the [[project]] in a specific location, like a drawn [[Action]] or a [[Measure]]. It's still possible to apply additional designs in other locations. First, make sure the [[Test_Run|test run]] is stopped. Ensure the list of [[Parametric Design]]s is opened in the [[left panel]]. | ||
|style="width: 10%"| | |style="width: 10%"|[[File:List_Of_ParamDesigns-2.jpg|200px|thumb|center|List of available parametric design plans on left panel.]] | ||
|- | |- | ||
|style="width: 5%"|2 | |style="width: 5%"|2 | ||
|style="width: 50%"|Take note of the full list of [[Parametric Design]]s. There are an Urban and a Rural design for each of the areas. Because not all areas have the same target for the green ratio, diffent parameters are appropriate for the different areas. The area near the Bosweg has a target green ratio of just 20%, so the urban design is sufficient for that location. However, for the other areas the rural designs are more appropriate. | |style="width: 50%"|Take note of the full list of [[Parametric Design]]s. There are an Urban and a Rural design for each of the areas. Because not all areas have the same target for the green ratio, diffent parameters are appropriate for the different areas. The area near the Bosweg has a target green ratio of just 20%, so the urban design is sufficient for that location. However, for the other areas the rural designs are more appropriate. | ||
|style="width: 10%"|[[File:Parametric_designs_urban.jpg|300px|center|thumb|]] | |style="width: 10%"|[[File:Parametric_designs_urban-2.jpg|300px|center|thumb|]] | ||
|- | |- | ||
|style="width: 5%"|3 | |style="width: 5%"|3 | ||
|style="width: 50%"|Experiment with applying the different plans for the different areas, reverting them and replacing them with other designs. You can also combine the design created earlier with the available options for the area near the Bosweg, so see if your design is better or worse overal. At any time you can stop the [[ | |style="width: 50%"|Experiment with applying the different plans for the different areas, reverting them and replacing them with other designs. You can also combine the design created earlier with the available options for the area near the Bosweg, so see if your design is better or worse overal. At any time you can stop the [[Test_Run|test run]] to undo all plans and start again. | ||
|style="width: 10%"|[[File:Parametric design demo example mixed | |style="width: 10%"|[[File:Parametric design demo example mixed 2.jpg|thumb|center|300px|Designs with different parameters leading to different plans.]] | ||
|} | |} | ||
== | ==Save your design as a measure== | ||
{| class="wikitable" | |||
|style="width: 5%"|1 | |||
|style="width: 50%"|Note that you can also save your created parametric design [[How_to_save_a_parametric_design_as_a_measure|as a measure]]. Your test run cannot be active for this. After saving the design as a [[measure]], you can apply it during a test run. You can also choose to click on Save to Current to construct the Design in the [[Current Situation]], however please note this cannot be easily reversed. | |||
|style="width: 10%"|[[File:Save_as_measure.PNG|thumb|center|300px|Click on Save as Measure]] | |||
|} | |||
{{article end | |||
|seealso= | |||
* [[Parametric Design]] | * [[Parametric Design]] | ||
* [[How to | * [[How to create a parametric design]] | ||
* [[How to create an urban area using parametric design]] | * [[How to save a parametric design as a measure]] | ||
* [[How to create an area of trees using parametric design]] | <!--* [[How to create an urban area using parametric design]] | ||
* [[How to create an area of trees using parametric design]] | |||
* [[How to create a measure to create an urban area using parametric design]]--> | * [[How to create a measure to create an urban area using parametric design]]--> | ||
* [[Indicator]] | * [[Indicator]] | ||
* [[Overlay]] | * [[Overlay]] | ||
* [[List of Demo Projects]] | |||
}} | |||
Latest revision as of 13:00, 12 December 2023
The Demo Parametric project is available for all users and can be found in the main menu under Edit projects. This project does not count towards your license.
This project is intended for urban planners and zoning policy makers.
This project showcases how parametric designs can be used for rapid planning and prototyping.
The demo is a project in which a location in The Netherlands has room for new urban development, and a number of Parametric Designs are prepared to allow for quickly designing entirely new urban areas. The project was originally created for a specific organization to test how the use of Parametric Design would affect their Indicators, but is now publicly available for all users to experiment with.
Exploring the project
To begin exploring the project, take the following steps:
| 1 | Click anywhere in the 3D Visualization, and use the arrow keys on your keyboard to move the Camera around. You can also move the camera with the mouse; See Camera#Standard. | |
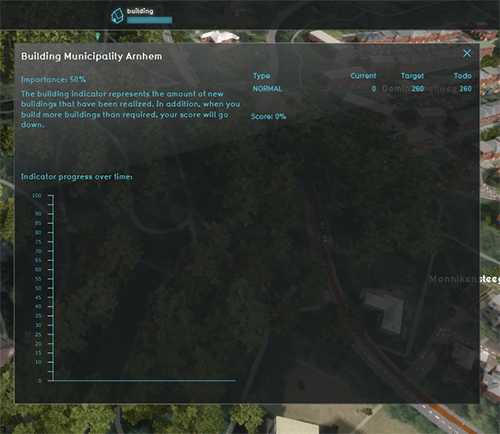
| 2 | At the top of the the viewer interface you can see the top bar. Click on any of the Indicators to open an indicator panel with information on how a score for the Project is determined.
The Green Indicator shows whether there is a sufficient amount of publicly available green space in a given area. Depending on the aspects of that location, the ratio should be anywhere from 10% to 60% to receive a minimum allowable score of 6. The default score (and maximum score) is 10. The Housing Indicator shows whether a sufficient amount of additional constructions have been planned, specifically housing. The target is set to 260 additional houses. |
|
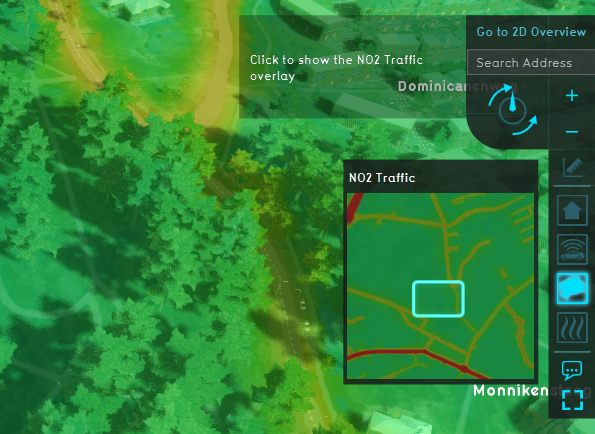
| 3 | On the right-hand side of the viewer interface you can see the navigation panel. Hover over the various icons to see a tooltip with their name. For demonstration purposes, there are a few Overlays available.
|
Point of interest
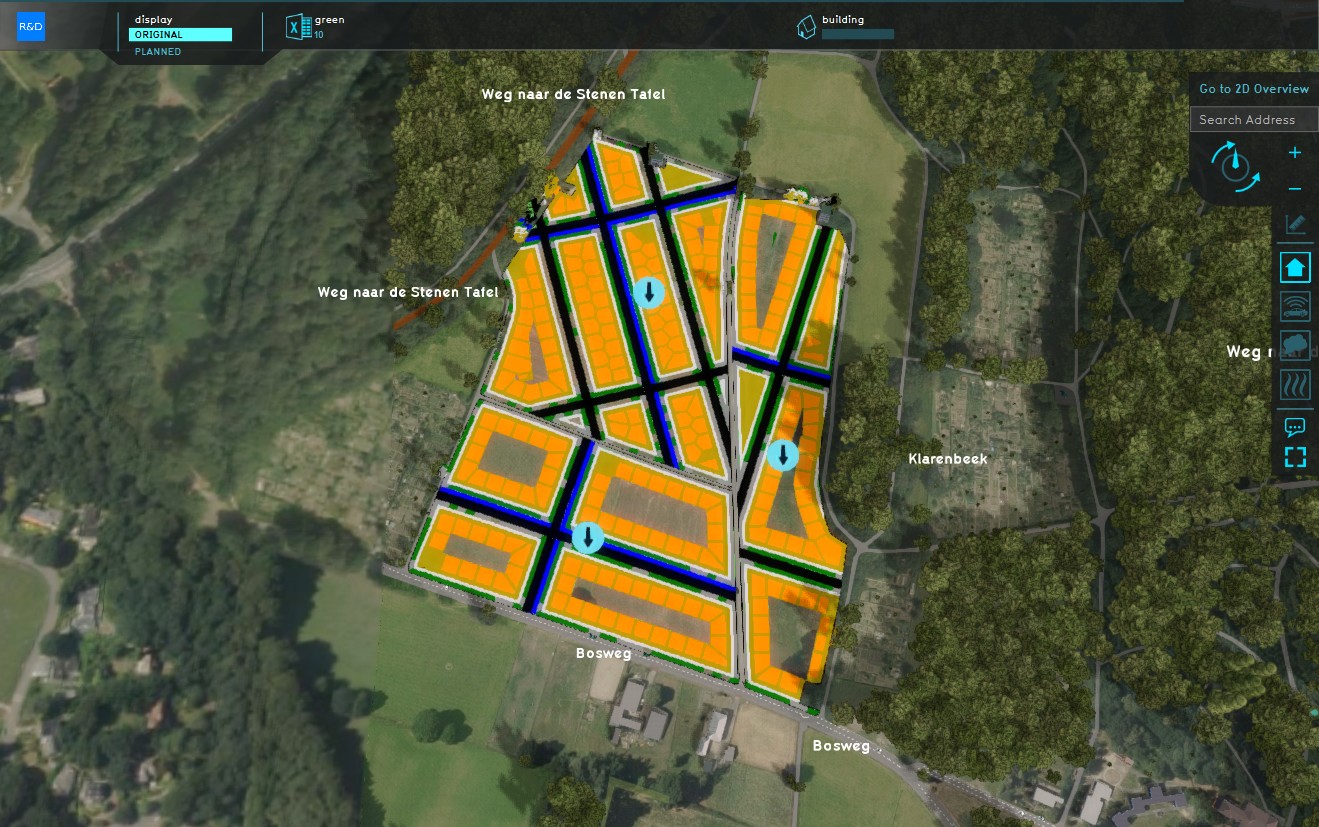
The most important location in this project is on the western side of the project area. This is an empty location in which Parametric Design can be employed to create an additional residential area. There are few areas defined, indicated by the arrows, which have specific requirements to compute the Green Indicator. Other than that, and the small country roads dividing the areas, it's just empty space to build on.
Actions
The project is focussed on experimenting with options for Parametric Designs. Note that some actions may result in the start of a test run.
This means the editing tools will be temporarily disabled. When you are done experimenting with actions, you can stop the testrun by clicking the stop button in the ribbon. This will revert the session back to its base state, without the effects of the applied action(s).
Prepared designs
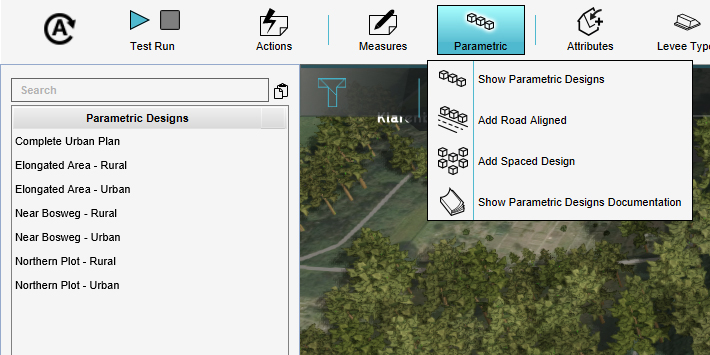
| 1 | Switch to the "Future design" tab, and then click on "Parametric". This will open the list of currently defined Parametric Designs in the left panel of the Editor. | |
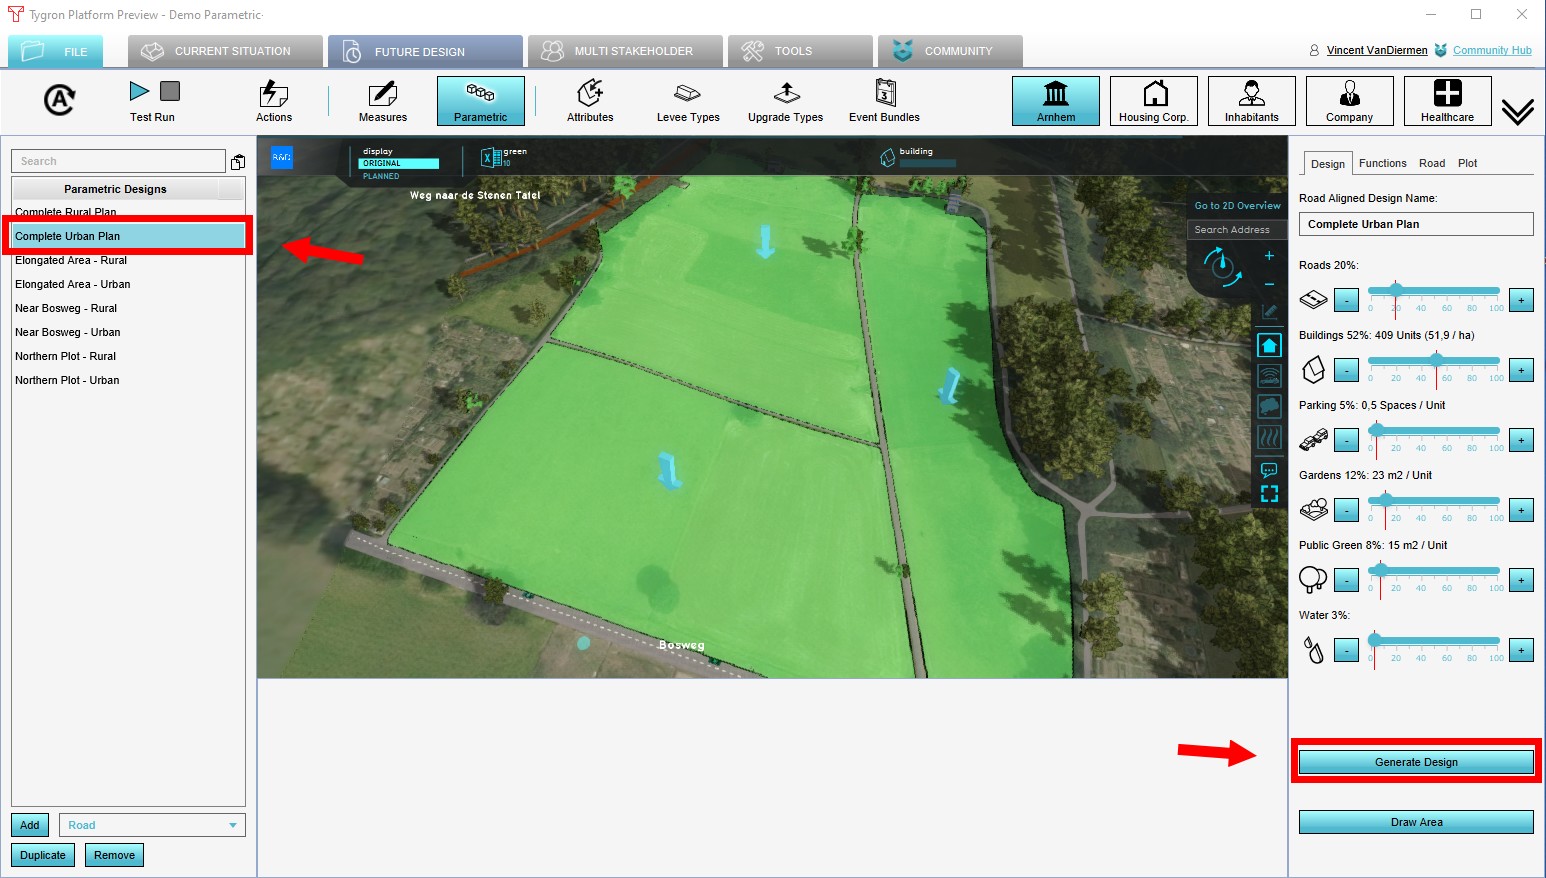
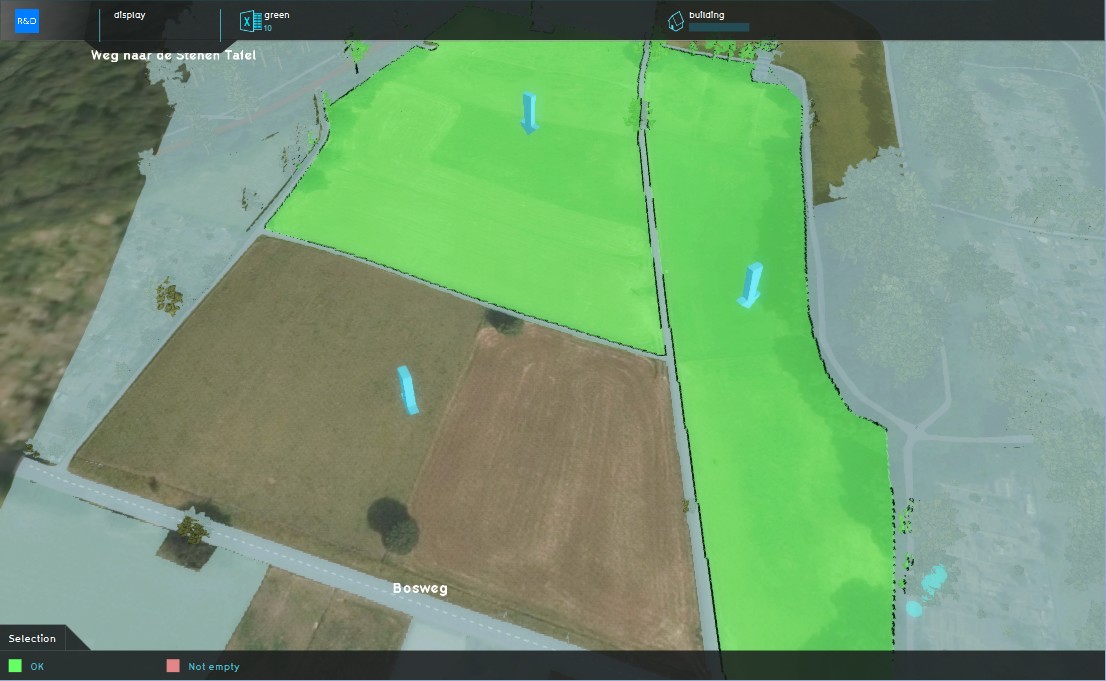
| 2 | Select "Complete Urban Plan" in the list of designs. The area of the plan is now highlighted in green. Select 'Generate Design' on the bottom right to continue. | |
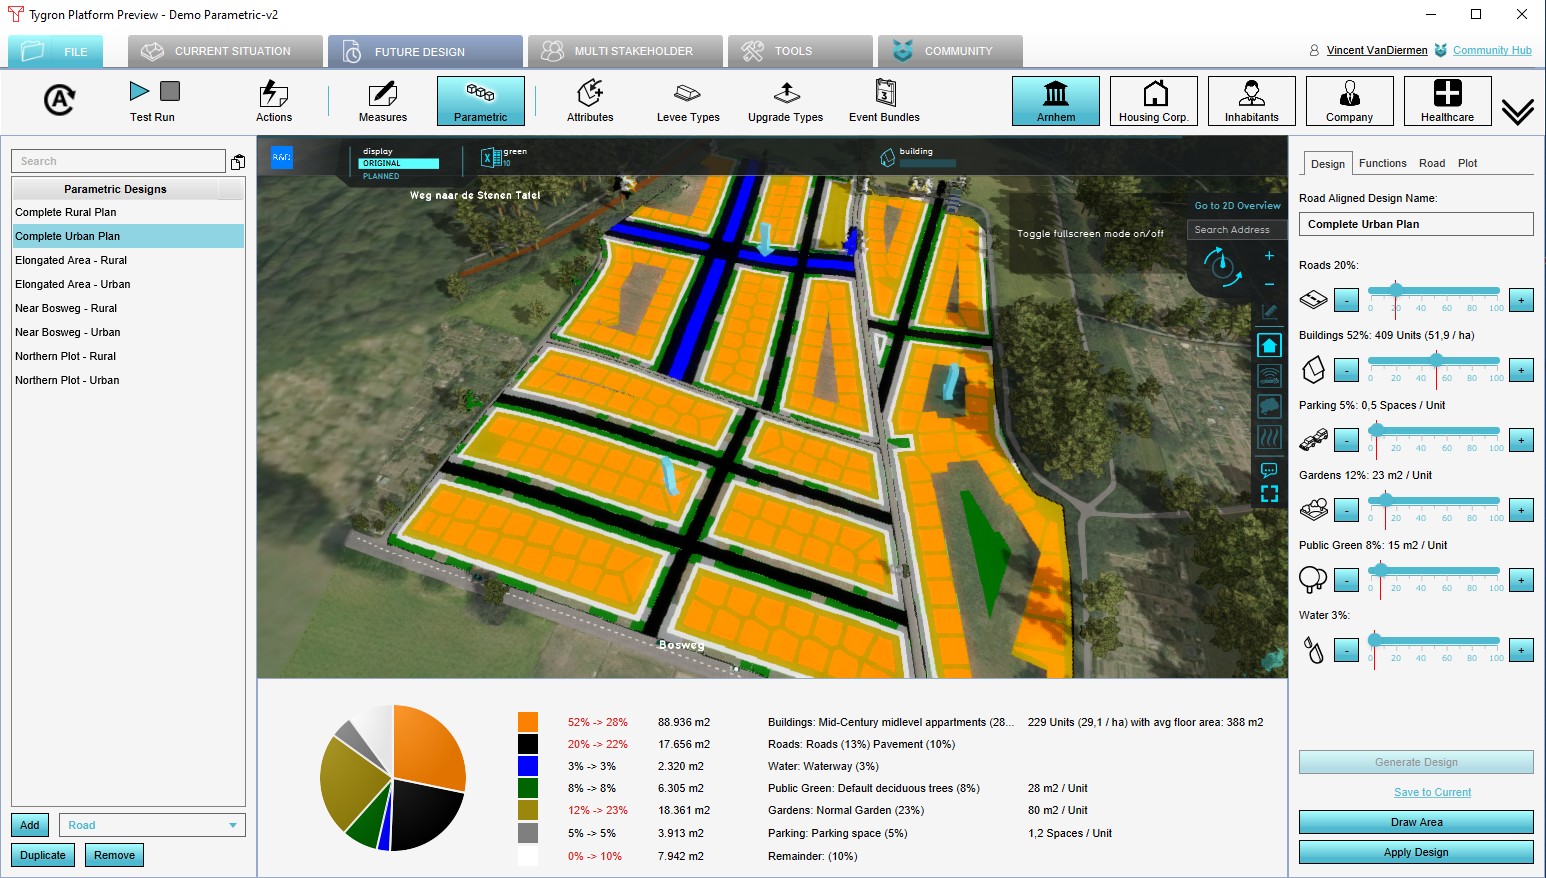
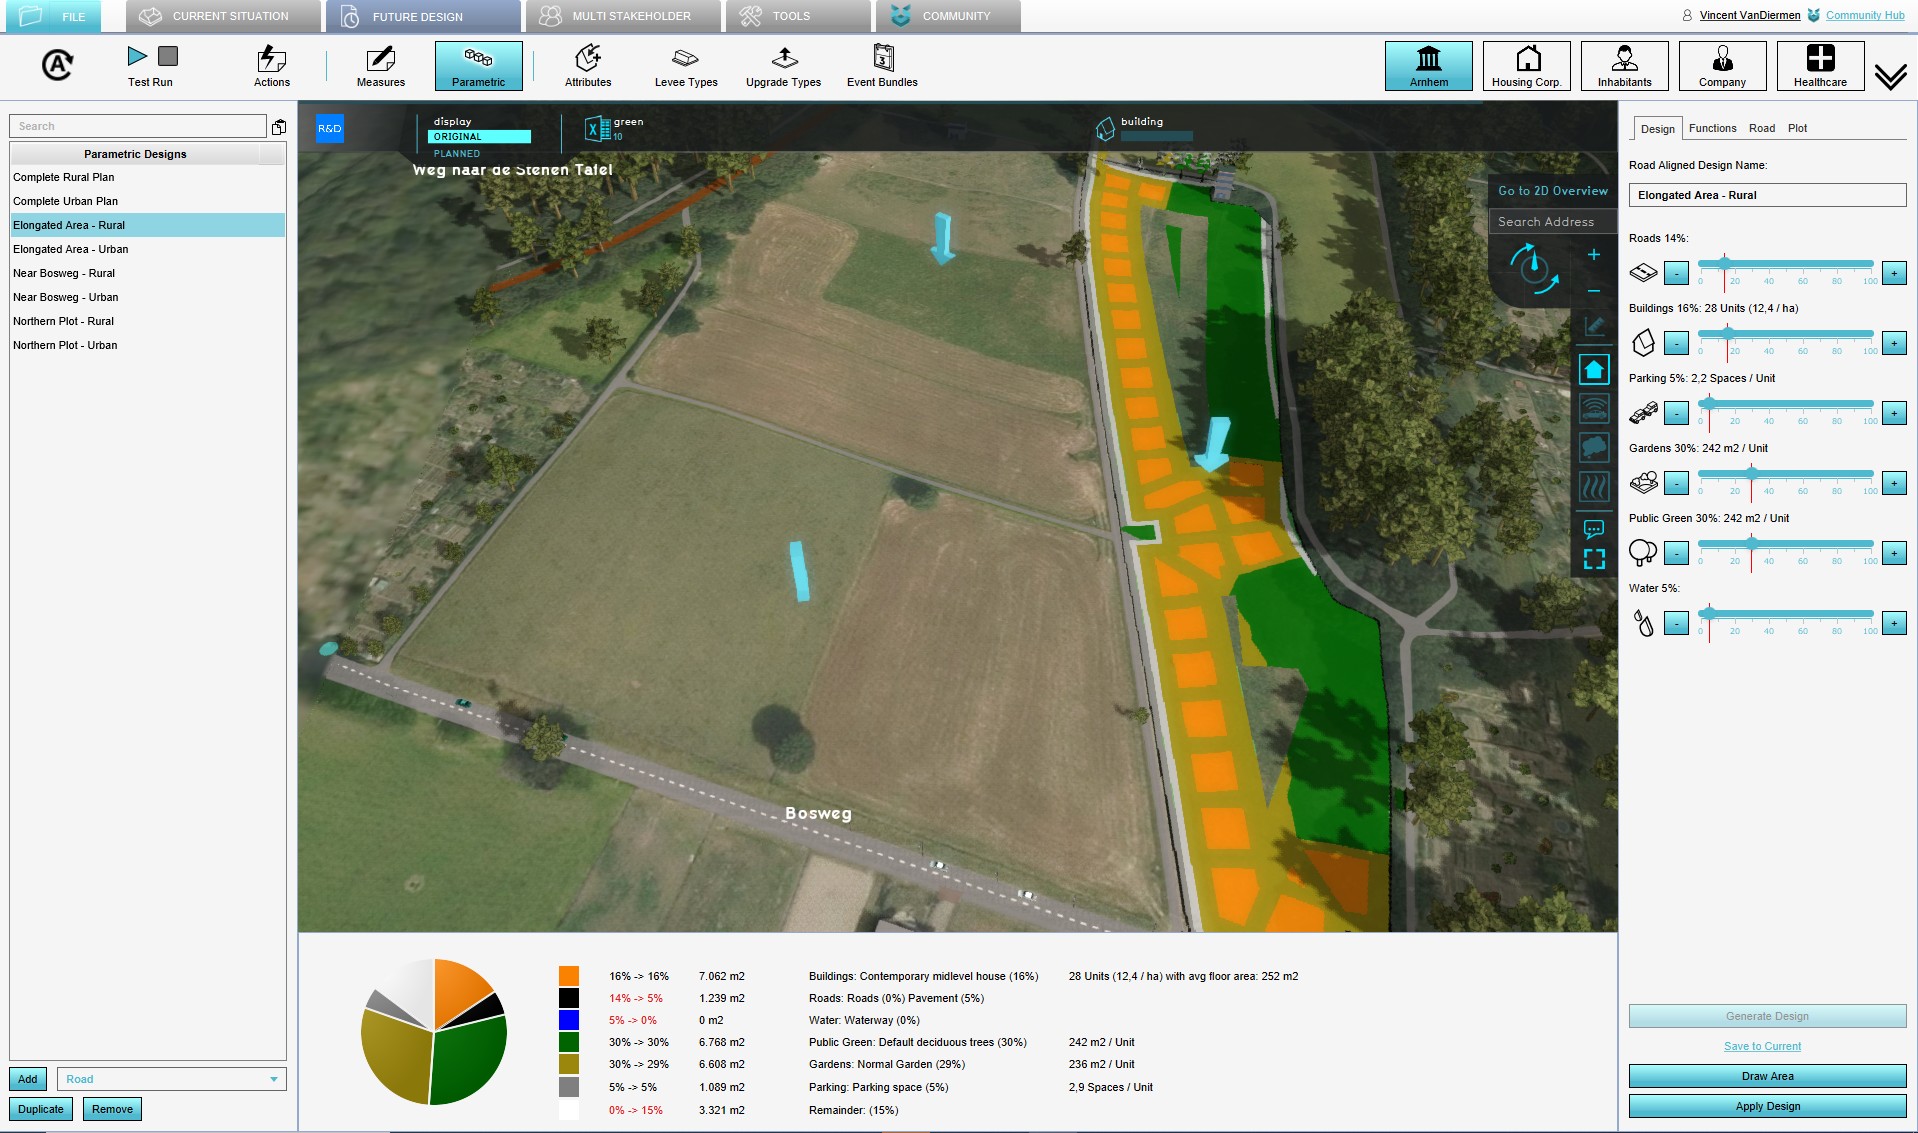
| 3 | In the 3D Visualization a colored representation of the planned design now appears. Sliders with details about this design are now available on the right panel of the editor display . Take note of the following:
All of the features you see are automatically generated, based on parameters of the design (hence the name). |
|
| 4 | In the bottom panel, you will also see a pie chart and a number of statistics regarding the design as it currently stands. The statistics show how much space will be taken up by each feature. It additionally shows a percentage, indicating how much of the total area of the design that represents. The pie chart is a graphical representation of those percentages. Note that the sum of the percentages (and thus the pie chart) may not add up to 100%, indicating some of the design's space is left empty. | |
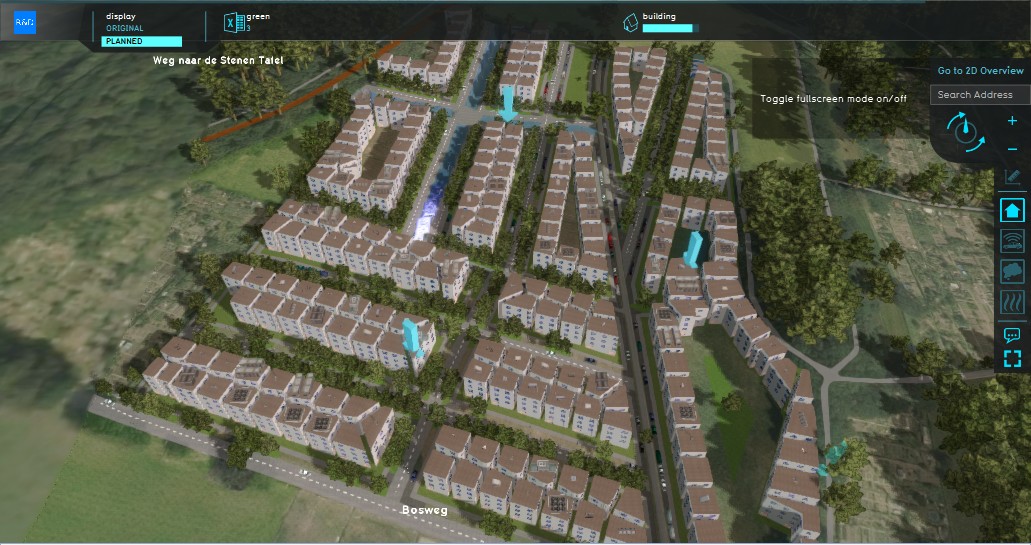
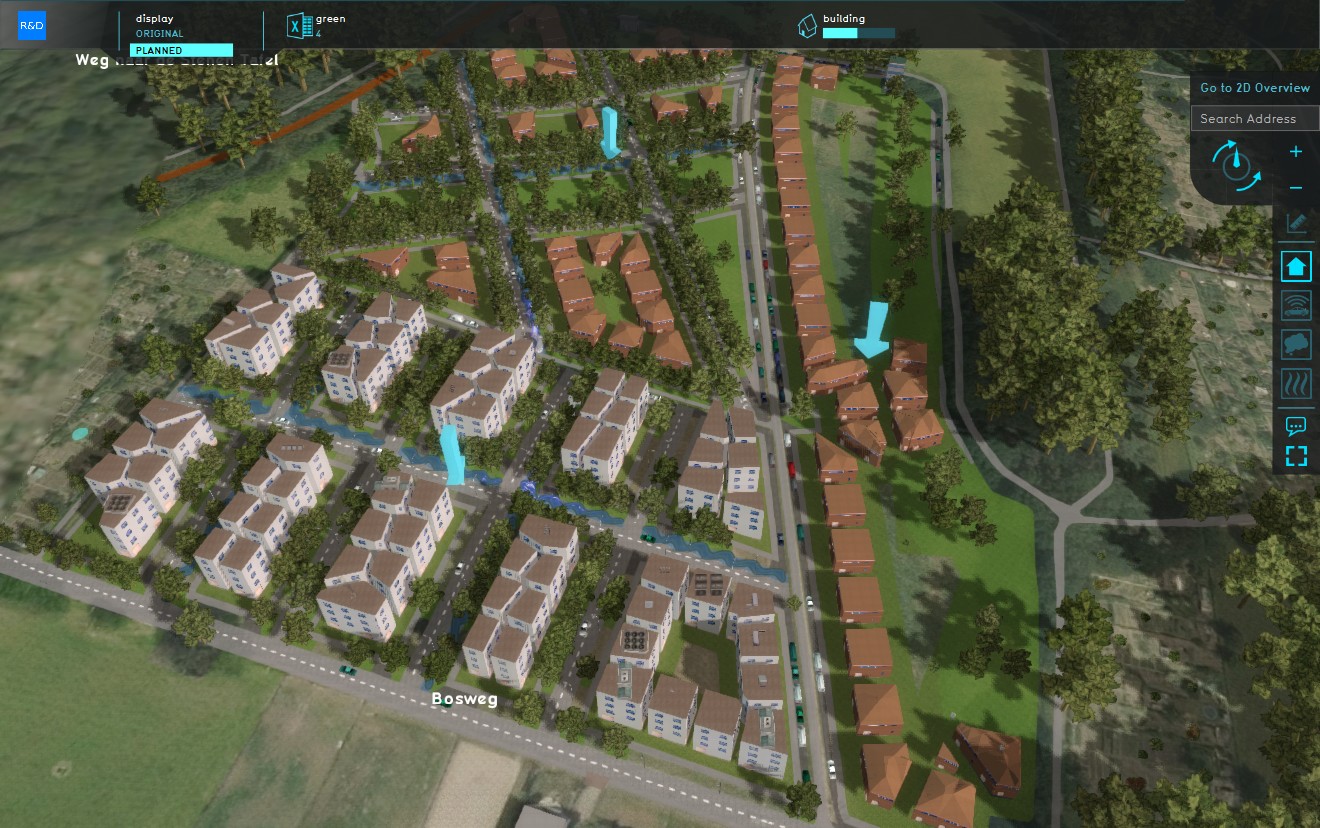
| 5 | At the bottom of the right panel, click on "Apply Design". Note that a test run will start; that's ok. You see a large amount of structures appearing in the 3D Visualization, matching the pattern previously displayed by the colored representation. | |
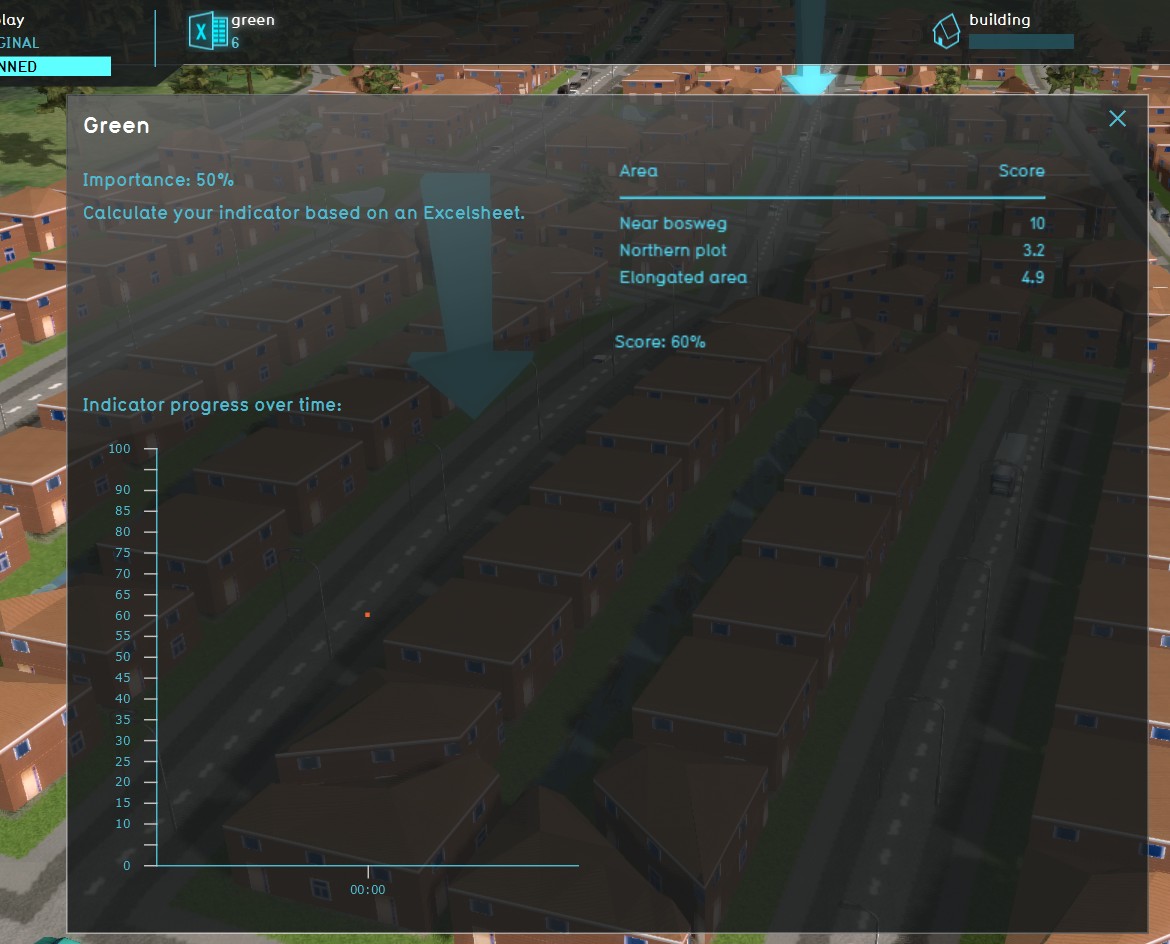
| 6 | Note that the Indicators in the top bar have changed as well. The average score for the Green Indicator has dropped from a 10 to 3. And if you click on the Indicator to see the scores per section of the planned area, you will even see that the scores for some areas have dropped even below that. | |
| 7 | At the bottom of the right panel of the Indicator, select "Revert Last Design". You will see the structures disappear from the 3D Visualization. The plan is now undone. |
Tweaking a design
| 1 | You can change the parameters of a design, so that the structure of the result better fits the needs of the surrounding use-case. In this case, to make the Green Indicator score better, the ratio of publically available green should be improved. More space should be unoccupied.
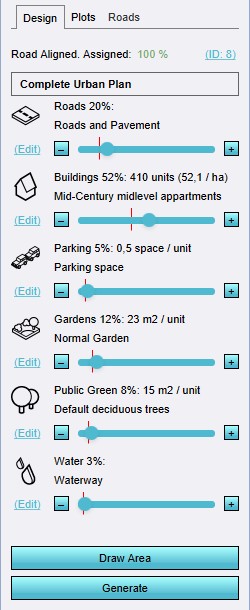
Ensure the "Complete Urban Plan" design is (still) selected, and take note of the parameters displayed in the right panel. There are many of them, because there are also many elements part of the design. |
|
| 2 | Find the "Water percentage". This parameter indicates how much water should be added, starting from the center of each block of plots. Given that for the Green Indicator the amount of open land should be maximized, any amount of water would effectively be a waste. Set this parameter to 0%. | |
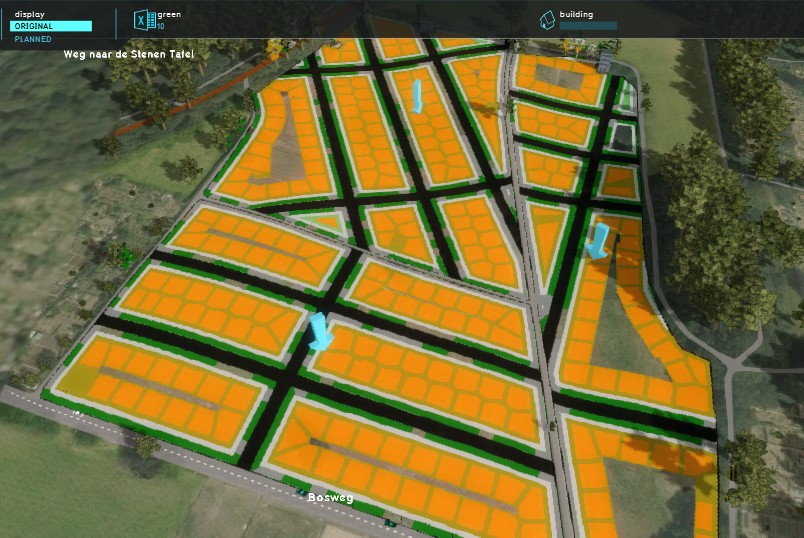
| 3 | As these changes were made, the colored representation of the Parametric Design in the 3D Visualization has changed along with it, determining a new layout based on the now changed parameters. | |
| 4 | Click on "Apply Design" again, and new structures will appear in the 3D Visualization. The road layout is subtly different, and no ponds have been created. The Green Indicator in the top bar now also shows an average score of 7, which is an obvious improvement over the previous design's score of 6. Click on it, and you will see that some areas still score below a 6, and thus are not up to scratch, but a step has been made in the right direction, compared to the original plan. |
Creating a design
| 1 | Other than creating and tweaking a pre-existing design, it is of course also possible to create a completely new Parametric Design. First, make sure the test run is stopped. | |
| 2 | Ensure the list of Parametric Designs is opened in the left panel, then click on "Add" at the bottom of the left panel. This adds a new Parametric Design. | |
| 3 | Select the newly created design and the right panel will display the properties of the new Parametric Design. A new design initially has default elements and values set. By clicking on the blue "Edit" links, you can select a new type of element for the default selection. The red lines on the sliders indicate the maximun value for a function in relation to the other functions. When you move one slider to the left, the red lines on the other sliders will move to the right, showing the space created by lowering one parameter. It is not possible to move a slider to the right of the red line. Only after lowering another parameter, can the maximum of a selected parameter be moved up. | |
| 4 | At the bottom of the right panel, click on "Draw Area". This will allow you to assign a location to the design. Use the brush to draw where the design should be applied to. Select the polygon of the Northern Plot, and of the Elongated Area on the east side of the relevant area. This is easiest to do with either the "polygon pick" selection mode or the "blueprint" selection mode. You can also use a different selection type if you find another one easier. However, ensure that the resulting selection is attached to or overlaps with an existing road. Click on "Apply selection" button to save the selection as the Parametric Design's location. | |
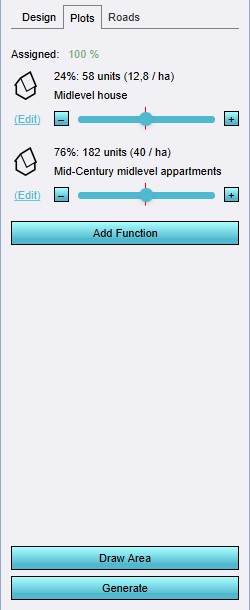
| 5 | At the top of the right panel, switch to the "Plots" tab. This shows the list of functions defined for the various plots a Parametric Design contains. By default one functions is selected as a starting point, but more can be added to fit the project with the "Add Function" button. You can see this in effect in the 'Mixed' plans that are available for all areas. | |
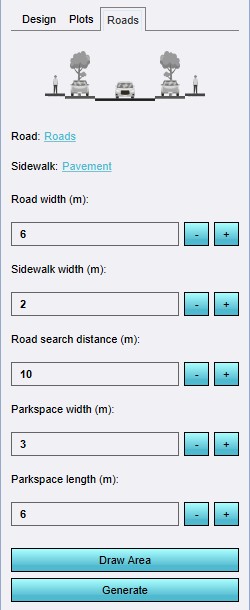
| 6 | Switch to the "Road" tab, and click on the blue "Roads" link to open the Function selection window. Here you can select which Function you would like to use as a road in your parametric Design. You can also select a different function type for the sidewalk. The entry fields let you adjust the width and other related values of the road, sidewalk and adjacent parking spaces. These settings all impact the amount and placement of the road function. Feel free to experiment with these. | |
| 7 | When ready, click on the 'Generate Design' button. | |
| 8 | Now the platform has calculated the most optimal placement of the parametric design. You can still adjust the parameters and generate the re-design again. | 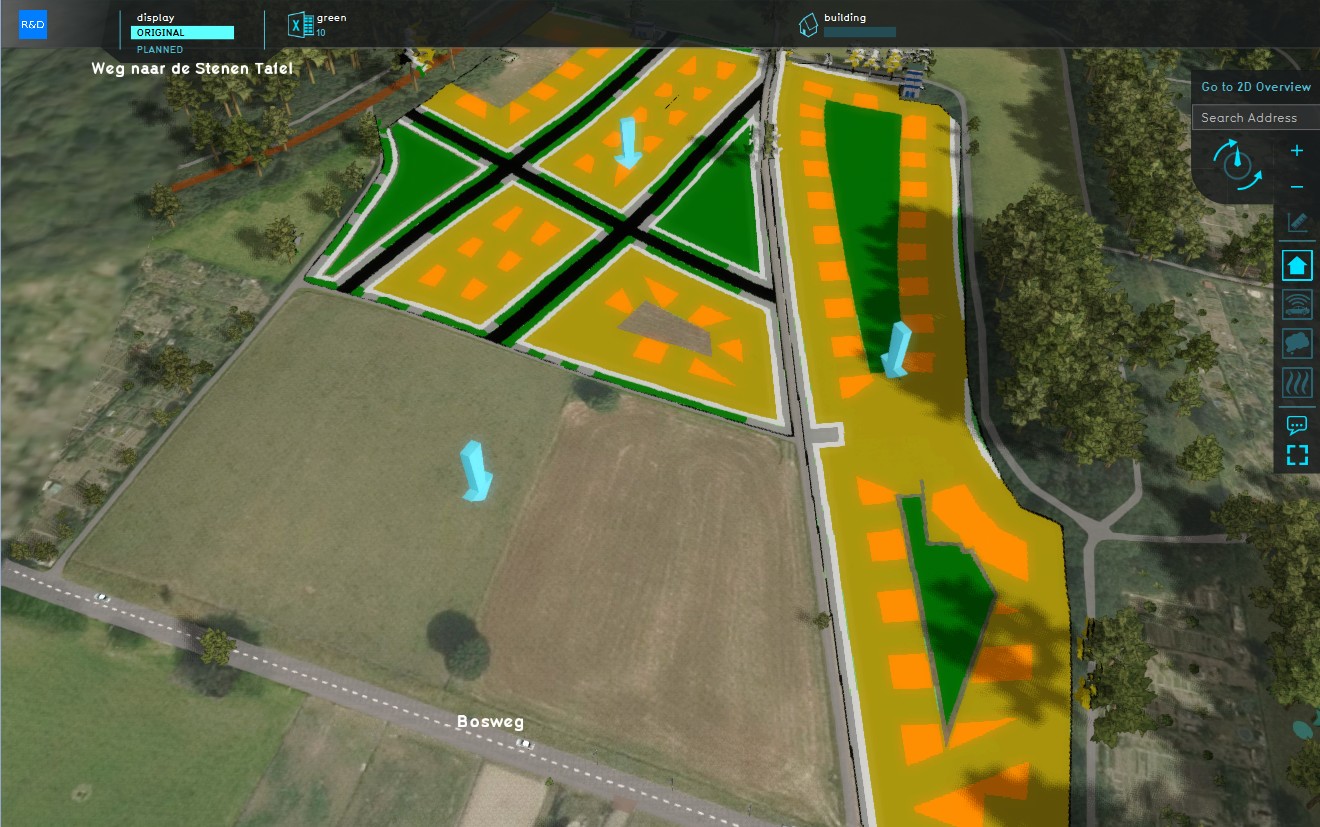 The new Parametric Design with plots and roads. |
| 9 | When the plan is finalized, you can select 'Apply Design'. | |
| 10 | A test run is started, while the plan is being applied and displayed in the 3D Visualization. Effect on indicators and overlays is calculated. | 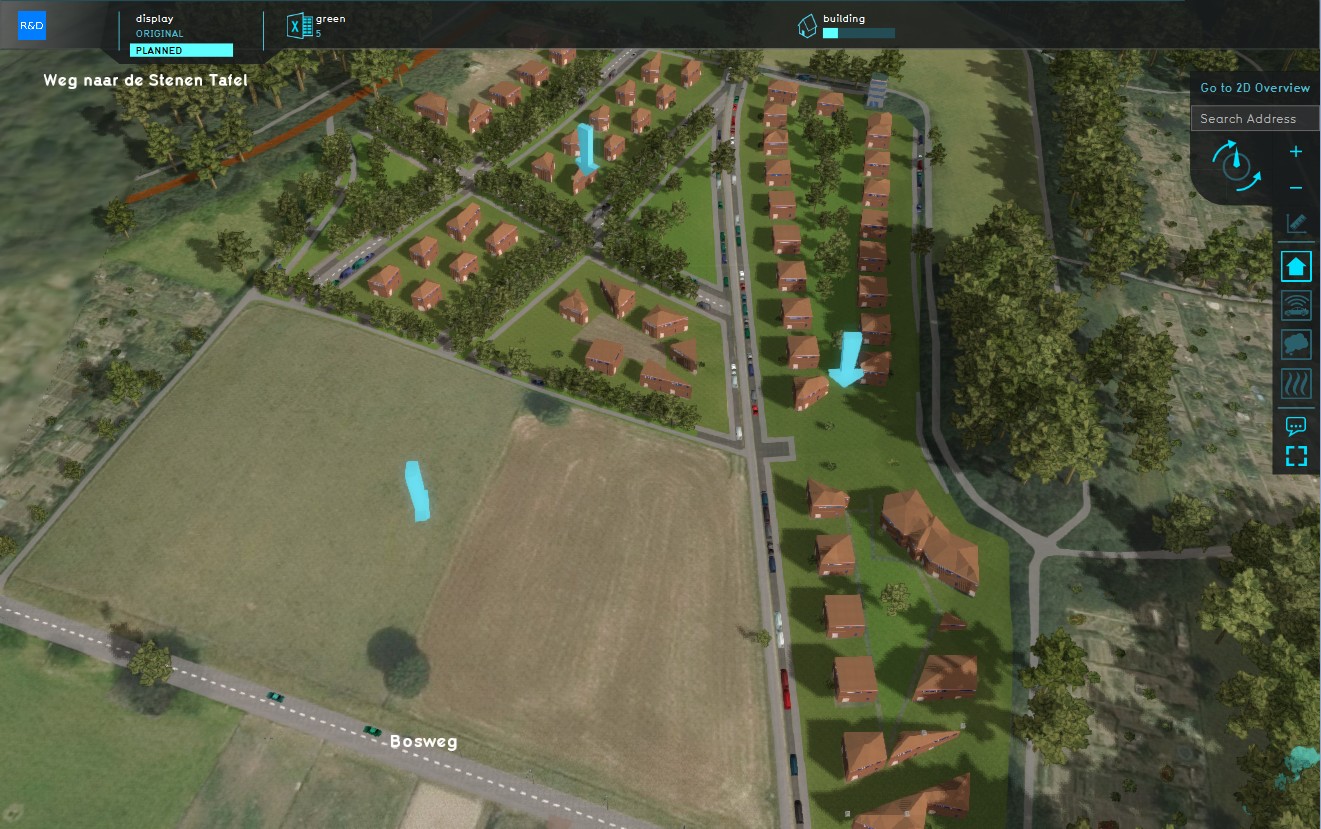 The new Parametric Design with plots and roads applied and visualized. |
Combining designs
| 1 | Rather than looking only at a single parameterized design, it is possible to combine separate multiple designs. A design is applied to the project in a specific location, like a drawn Action or a Measure. It's still possible to apply additional designs in other locations. First, make sure the test run is stopped. Ensure the list of Parametric Designs is opened in the left panel. | |
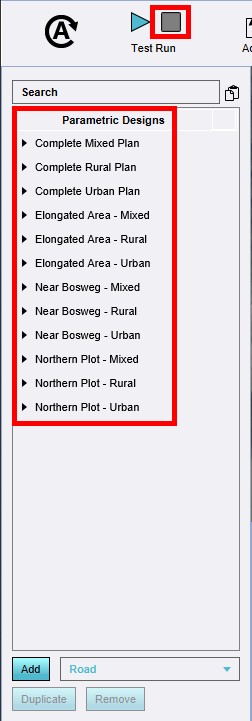
| 2 | Take note of the full list of Parametric Designs. There are an Urban and a Rural design for each of the areas. Because not all areas have the same target for the green ratio, diffent parameters are appropriate for the different areas. The area near the Bosweg has a target green ratio of just 20%, so the urban design is sufficient for that location. However, for the other areas the rural designs are more appropriate. | |
| 3 | Experiment with applying the different plans for the different areas, reverting them and replacing them with other designs. You can also combine the design created earlier with the available options for the area near the Bosweg, so see if your design is better or worse overal. At any time you can stop the test run to undo all plans and start again. |
Save your design as a measure
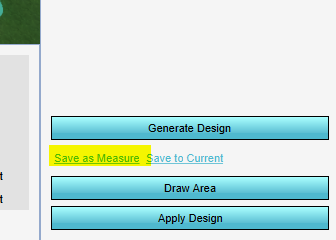
| 1 | Note that you can also save your created parametric design as a measure. Your test run cannot be active for this. After saving the design as a measure, you can apply it during a test run. You can also choose to click on Save to Current to construct the Design in the Current Situation, however please note this cannot be easily reversed. |
