Demo Breach Project

The Demo Breach project is available for all users and can be found in the main menu under Edit projects. This project does not count towards your license.
This project is intended for hydrologists and other water experts.
This project showcases the flooding overlay in a basic setup with a breach.
The demo is a working project in which a location in The Netherlands experiences a breach in a levee holding back a large amount of water. It can serve to explore how breaches are modeled in the Water Module, how they are configured, and how the consequences of a flooding can be analysed. The project simulates a breach which grows over time, allowing as much water to flow through as the lake contains and the dynamic size of the breach allows over a 30 minute period.
Exploring the project
To begin exploring the project, take the following steps:
- Click anywhere in the 3D Visualization, and use the arrow keys on your keyboard to move around in the world. You can also drag the camera around by right-clicking (and holding the right mouse button down) in the 3D Visualization and dragging the world around. Use the scroll wheel to zoom in- and out.
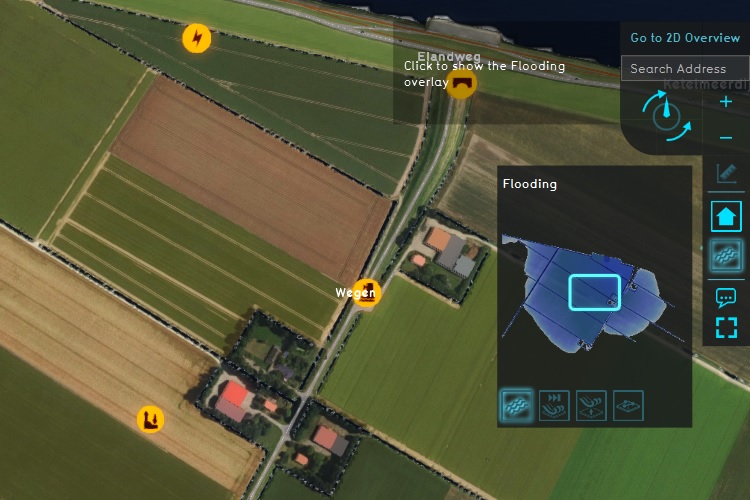
- On the right-hand side of the viewer interface you can see the navigation panel with the overlay icons. Hover over the various icons to see a tooltip with their name. Find the overlay named "Flooding", and click on it. This will show the overlay in the 3D Visualization. This overlay shows the amount of water in the world during the flooding simulation.
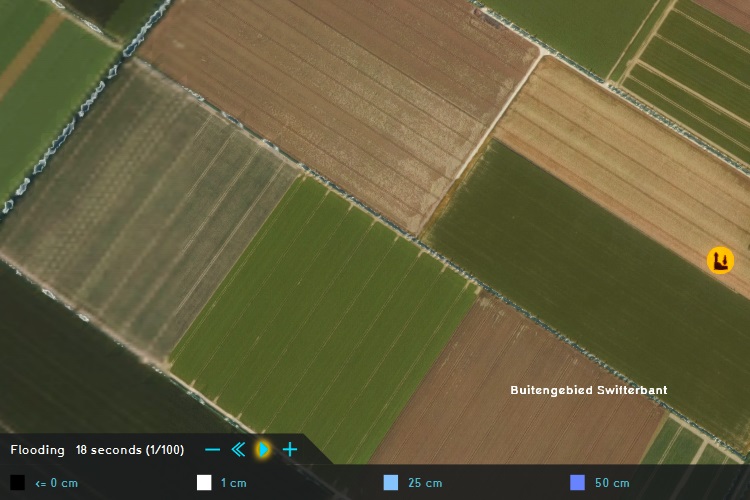
- At the bottom of the interface a legend will now appear, with on the left-hand side of the legend a few buttons to "play" the overlay. Zoom out so that you can see a large swat of land, and click on the "play" button. You will see how the state of the water changes over time.
- Hover over the icon for the overlay again, and notice that more options appear for overlays related to flooding. These are the child overlays, which can display more types of results from the flooding simulation.
- Finally, notice a number of icons floating in the world. The orange icons denote points-of-interest which you can take a closer look at. You can click on any to open a panel with more information.
-
 Select an overlay on the right hand side.
 -
 Press "play" in the legend to animate the results.
 -
 Hover over the water overlay icon, and then select any child overlay.
 -
 Icons in the world will provide more information.


Points of interest
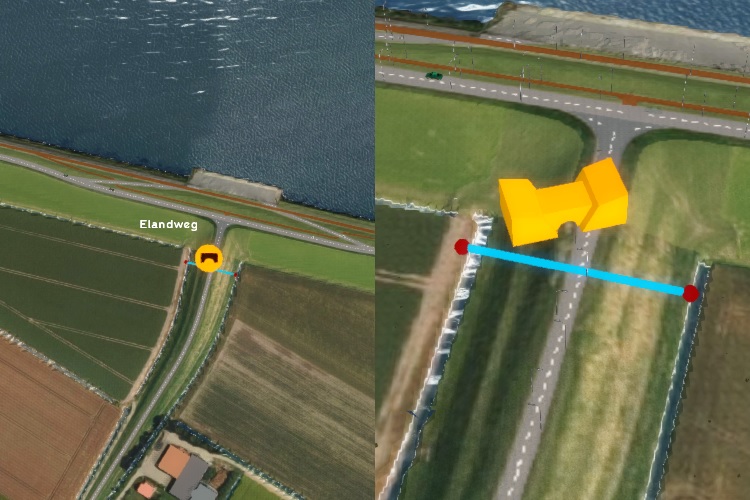
Breach

A levee exists between the large lake to the north, and the farms and small groups of buildings to the south. On this levee, an "Area" has been drawn to represent the point of a breach. The properties of the breach are defined as attributes of the drawn Area. The breach starts small, but as part of the simulation, it will grow over time, allowing more water to flood in.
Clicking on the popup will show the Base Types overlay, which shows what features are present in the project map for the purpose of the flooding simulation.
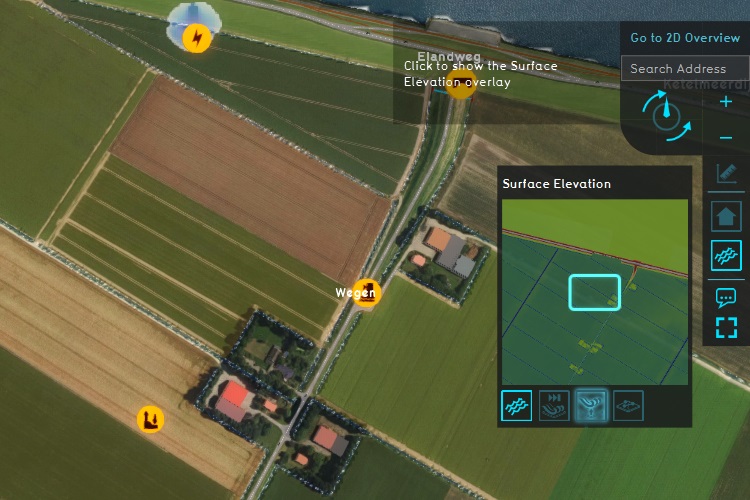
Elevation

Applications for the Flooding Overlay include determining what locations would be impacted by a sudden flood. A large factor in what determines what evacuation routes are or aren't obstructed, or what structures are affected by flooding, is variety in elevation. The higher the terrain, the higher the water must get before it can flow across and impact construction on or behind the elevated area.
At the location of the elevation popup, some subtle variety exists in the height of the terrain, causing water to flow around certain plots before enough water builds up to flow over it. This makes some locations more suitable as temporary safe locations or evacuation routes. However, strictly, the variance is so small across this area that the difference is minute at best.
Culvert

This location features a terrain elevation in the form of an internal levee, blocking water from flowing further. However, in this location a culvert also exists, a pipe allowing water to flow through. Under normal circumstances this would connect water bodies to form a direct connection. However, excessive water (such as a flooding) can also flow through.
Flow-through is effectively only limited by the diameter of the culvert. The flow-through is calculated by the culvert formula. To see how a culvert is configured, navigate to the following location in the editor:
In the wizard, click on "Next" until you reach the step on "Culverts". There, select the culvert to inspect its attributes.
External Water Area

The lake to the north has a surface area of more than 1000km². All this water can potentially flow through the breach, but it would be excessive to have the entire lake in the project in full. Instead, the breach is configured to draw water from a virtually defined water area, which is configured with the parameters of the real lake.
To see how the breach is configured, navigate to the following location in the editor:
In the wizard, click on "Next" until you reach the step on "Breach areas". There, select the breach to inspect its attributes. The following attributes define the virtual external water area:
Measurement tool

While the Flooding Overlay or the Rainfall Overlay is active, it's possible to get more in-depth information on the impact of the water for any given location by using the Measuring tool. Select the measurement tool on the right side of the interface (the ruler icon at the top of the list of Overlays). The measurement tool will open. Click anywhere in the world to see a graph of the water heights there.
You can also switch modes to a line-based measurement, and play the Overlay to see the water heights change based on the simulation time.
You can get a cross-section of the waterlevels relative to datum by doing the following:
- Select the flooding overlay in the right menu bar
- Place a line measurement using the Measurement Tool and clicking in the 3D Visualization
- In the measurement tool, in the "Base" Overlay dropdown, select the "Surface Elevation"
- In the measurement tool, check the "Sum" option, to add the values of the two layers together
- In the measurement tool, Select the "Fit graph" mode to use the full extent of the measuring window
The result is a cross-section of the water and the terrain height.
Actions

After inspecting the consequences of the defined flooding, it is possible to explore potential remedies. Note that when any of the actions described here are taken, a Test Run will start automatically.
This means the editing tools will be temporarily disabled. When you are done experimenting with actions, you can stop the test run by clicking the stop button in the ribbon. This will revert the session back to its base state, without the effects of the applied action(s).
Levee


Switch to the "Future design" tab, and then in the viewer interface the Action Menu will appear. Open the menu with "Landscaping" options, and select the "Levee" action. You are now able to draw a line which will be the site of a new levee. Draw one or more lines in a protective formation near one of the farms which is affected by the flood. When you have made the selection, select "Ok". This will create a new levee, which will block water flowing across the land.
After making the change, the flooding overlay will be recalculated, and the new results will indicate how water would act with the new levee. In all probability, the levee will not stop all the water permanently, but may serve to delay the water, granting more time for people to prepare or evacuate. At the top of the interface, in the Top bar, find the "display" option, and select the "Original" mode. This will display the results of the original calculation. Activate the flooding overlay and find the moment in time where the water surrounds the farm. Now switch the display mode to "Planned". This will show the results of the overlay based on the effects of the levee. If the levee is effective, the new results will show the farm less (or not yet) affected by the water at the same moment in time. Forward the overlay result slightly to see the new moment where the farm is affected. All time in between is evacuation time gained by creating a levee in well-conceived location.
See also