Weir height test case (Water Module): Difference between revisions
(→Inlets) |
|||
| Line 33: | Line 33: | ||
====Inlets==== | ====Inlets==== | ||
* Inlet (Constant): | * Inlet (Constant): | ||
** Rectangle shape: [189.82, -254. | ** Rectangle shape: [189.82, -254.350], [202.08, -251.510] | ||
** [[Inlet area (Water Overlay)|INLET_AREA]] = 1.0; | ** [[Inlet area (Water Overlay)|INLET_AREA]] = 1.0; | ||
** [[Inlet q (Water Overlay)|INLET_Q]] = 1.0; | ** [[Inlet q (Water Overlay)|INLET_Q]] = 1.0; | ||
| Line 41: | Line 41: | ||
* Inlet (Manual) | * Inlet (Manual) | ||
** Rectangle shape: [192.116, -331. | ** Rectangle shape: [192.116, -331.225], [199.453, -328.390] | ||
** [[Inlet area (Water Overlay)|INLET_AREA]] = 1.0; | ** [[Inlet area (Water Overlay)|INLET_AREA]] = 1.0; | ||
** [[Inlet q (Water Overlay)|INLET_Q]] = 1.0; | ** [[Inlet q (Water Overlay)|INLET_Q]] = 1.0; | ||
| Line 49: | Line 49: | ||
* Inlet (Adjusting) | * Inlet (Adjusting) | ||
[[File:Weir_flow_test_case_adjusting_inlet_q.png|thumb|200px|right|Inlet Q that is adjusting over time, visualized using the Measurement Tool's object attribute inspection.]] | [[File:Weir_flow_test_case_adjusting_inlet_q.png|thumb|200px|right|Inlet Q that is adjusting over time, visualized using the Measurement Tool's object attribute inspection.]] | ||
** Rectangle shape: [197.019, -444. | ** Rectangle shape: [197.019, -444.276], [204.623, -441.738] | ||
** [[Inlet area (Water Overlay)|INLET_AREA]] = 1.0; | ** [[Inlet area (Water Overlay)|INLET_AREA]] = 1.0; | ||
** [[Inlet q (Water Overlay)|INLET_Q]] = [0, 1, 600, 1, 900, 1.5, 1200, 1.5, 1800, 1.5, 2400, 1, 3600, 1]; | ** [[Inlet q (Water Overlay)|INLET_Q]] = [0, 1, 600, 1, 900, 1.5, 1200, 1.5, 1800, 1.5, 2400, 1, 3600, 1]; | ||
Revision as of 13:13, 16 January 2023
This page contains information how to inspect weir flow for Water Overlays. It also sets up a test case, which is described first.
Description
This test case consists of several weirs situated in a waterway, with each weir having different properties. All weirs are part of the same Water Overlay's simulation. There is no rainfall in this test case. Instead water flow is provided by inlets and outlets, which can be set up either variable or constant.

Boundary and initial conditions
- Waterways with weirs in the middle, separating two water areas.
- One inlet per waterway providing an influx of water, situated in the water area on the left.
- One outlet per waterway providing an outflux of water, situated in the water area on the right.
Parameter values
- Manning’s n: 0.03 (uniform)
- Model grid resolution: 1m
Technical setup
Waterways
Four waterways with a water depth of 2m and an angle of repose of 35 degrees, drawn with the following polygons:
- [187.0, -249.288], [418.0, -256.288]
- [413.0, -333.288], [189.0, -326.288]
- [194.0, -375.287], [411.0, -382.287]
- [404.0, -447.430], [194.0, -440.430]
Water Areas
Two areas divide the water ways into two sections:
- Water area (left)
- Rectangle shape: [301.0, -226.466], [158.884, -464.466]
- WATER_LEVEL = 0.0;
- Water area (right)
- Rectangle shape: [424.884, -226.466], [301.0, -464.466]
- WATER_LEVEL = 0.0;
Inlets
- Inlet (Constant):
- Rectangle shape: [189.82, -254.350], [202.08, -251.510]
- INLET_AREA = 1.0;
- INLET_Q = 1.0;
- LOWER_THRESHOLD = -10 000 (inactive);
- UPPER_THRESHOLD = -10 000 (inactive);
- Inlet (Manual)
- Rectangle shape: [192.116, -331.225], [199.453, -328.390]
- INLET_AREA = 1.0;
- INLET_Q = 1.0;
- LOWER_THRESHOLD = -10 000 (inactive);
- UPPER_THRESHOLD = -10 000 (inactive);
- Inlet (Adjusting)

- Rectangle shape: [197.019, -444.276], [204.623, -441.738]
- INLET_AREA = 1.0;
- INLET_Q = [0, 1, 600, 1, 900, 1.5, 1200, 1.5, 1800, 1.5, 2400, 1, 3600, 1];
- LOWER_THRESHOLD = -10 000 (inactive);
- UPPER_THRESHOLD = -10 000 (inactive);
Outlets
Each outlet is set up with the following attributes to remove the water that passed through the weir:
- INLET_AREA = 1.0;
- INLET_Q = 0;
- UPPER_THRESHOLD = -0.5;
The outlets are situated at:
- Outlet (Constant):
- Rectangle shape: [414.554, -250.689] , [396.786, -253.873]
- Outlet (Manual):
- Rectangle shape: [410.115, -327.753] , [ 393.13, -330.9620 ]
- Outlet (Adjusting):
- Rectangle shape: [ 401.072, -442.541 ], [ 383.968, -445.520 ]
Weirs
Each weir is setup using a rectangular shape, and direction angle and a weir height and width:
- WEIR_ANGLE = 270 degrees;
- WEIR_HEIGHT = 0 m;
- WEIR_WIDTH = 5 m;
Weir specific:
- Weir (Constant)
- Rectangular shape: [ 299.593, -248.328 ] , [ 302.229, -257.983 ]
- Weir (Manual)

- Rectangular shape: [ 298.675, -324.174 ] , [ 301.613, -335.662 ]
- WEIR_HEIGHT = [ 0 0 600 0.2 1200 0.2 1500 0.2 1800 -0.5 2400 -0.5 2700 0 ];
- Weir (Adjusting)
- Rectangular shape: [ 298.406, -437.681 ] , [ 301.142, -449.731 ]
Overlay settings
General parameters that have been used:
- Type of overlay: Flooding Overlay
- Weather:
- Evaporation: 0 mm
- Rain: 0 mm
- Simulate for: 1.5 hours.
- Groundwater: 0 (off)
- Calculation mode: Accuracy
- Output results: Surface last value, Surface last datum and Surface elevation
Inlets
In order to regulate the water level according to the water level graph, we used the following setup: On gridcells with x = 1 and x = 2 Inlet objects were placed. Each inlet had its own grid cell. The inlets were configured as:

- External area (m2): 1 000 000 000;
- Water level (m): 1;
- Inlet Q (m) :
| time (hrs) | inlet Q (m3/s) |
|---|---|
| 0, | 1000, |
| 11 | 1000 |
| 11 + 1 sec | -1000 |
| 22 | -1000 |
- Threshold (m): dynamic;
The threshold array was set using a .csv-file that approximated there water level over time. It is approximated since our water levels remain the same for a given period of time (no linear interpolation between time key - values). However, this setup proved accurate enough. The inletthresholds.csv-file can be found in the zip-file below.

Output as required
- Software package used: Tygron Platform
- Numerical scheme: FV (Kurganov, Bollerman, Horvath)*
- Specification of hardware used to undertake the simulation:
- Processor: Intel Xeon @2.10GHz x 8,
- RAM 62.8 GiB,
- GPU: 2x NVidia 1080
- Operating system: Linux 4.13
- Time increment used: adaptive: 0.25 - 1.13 s.
- Grid resolution: 10 m.
- Simulation time: 28s.
- Remaining volume water: 10050 m3
Measured point graphs are displayed below:
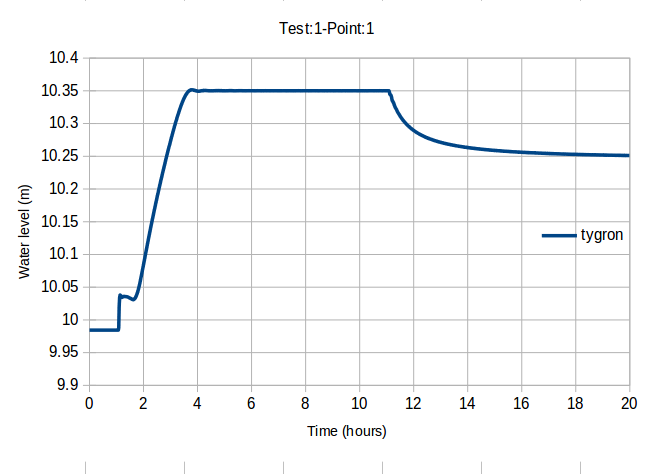
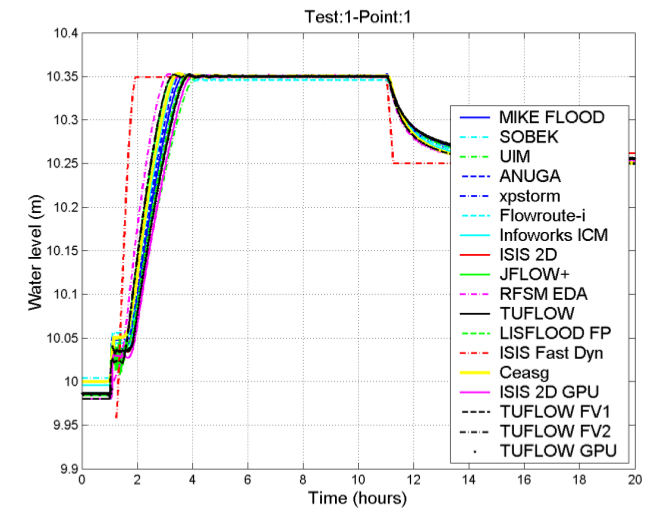
- Graph of point 1 generated by the Tygron Platform on the left and generated by others on the right.
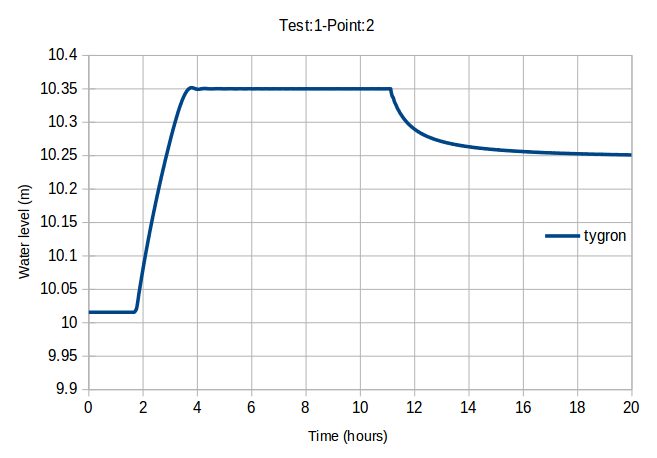
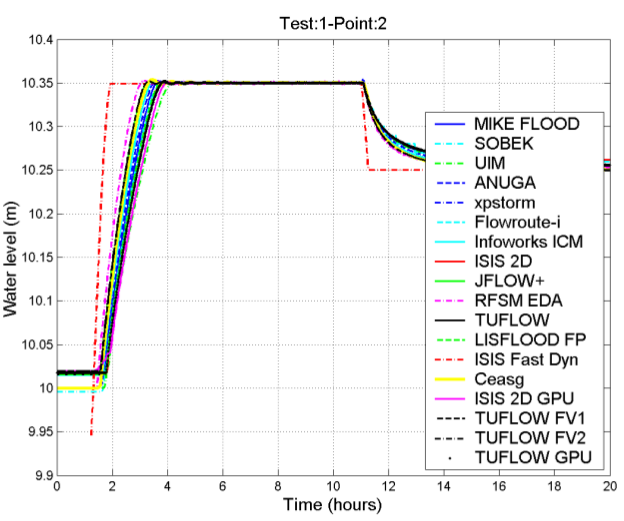
- Graph of point 1 generated by the Tygron Platform on the left and generated by others on the right.
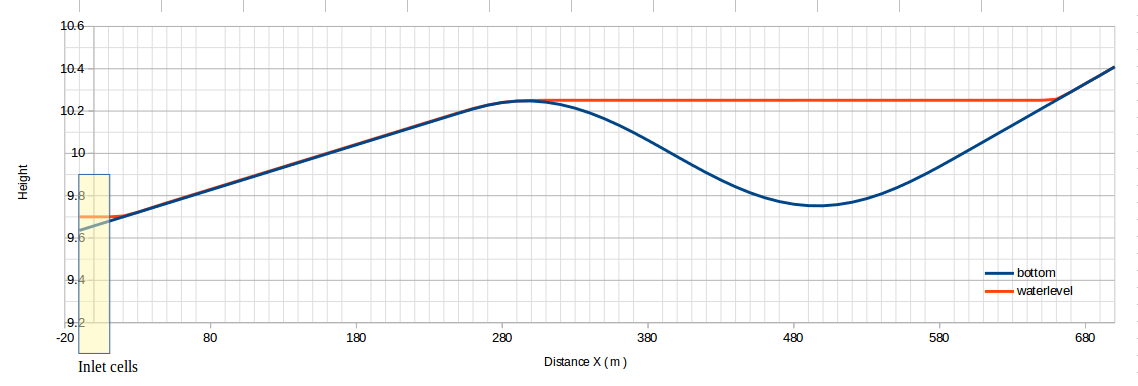
- Slice of the situation in the x -direction, generated by the Tygron Platform.


Notes
- Tests are run with multi gpu setup. For small cases like this, running it on a single gpu is actually faster: 17 seconds, which is +- 40% compared to 2.


