Evaporation m (Water Overlay): Difference between revisions
Jump to navigation
Jump to search
mNo edit summary |
No edit summary |
||
| (20 intermediate revisions by 2 users not shown) | |||
| Line 8: | Line 8: | ||
|An [[Attribute array|array]] of values, each pair indicating until what time that period of evaporation will last and what amount evaporates in that period. | |An [[Attribute array|array]] of values, each pair indicating until what time that period of evaporation will last and what amount evaporates in that period. | ||
|} | |} | ||
{{article end | |||
|notes= | |||
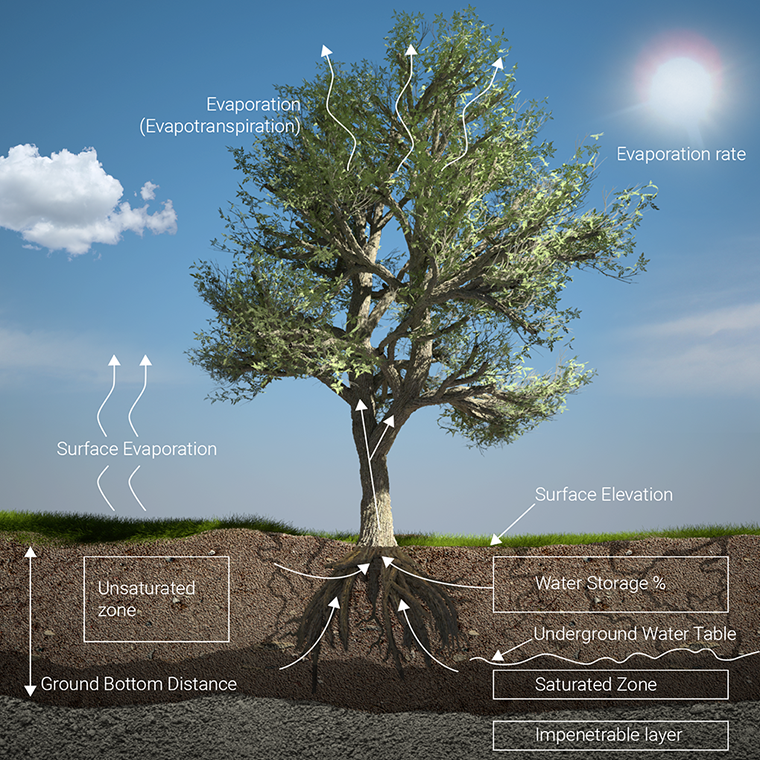
[[File:Evaporation_total.png|thumb|Image of the [[Evaporation model (Water Overlay)|evaporation model]] in the [[Water Module]]]] | |||
* A maximum of {{array max|pairs}} can be defined. | |||
* Internally each period with amount values are converted to an evaporation rate per second at a particular time in the simulation. | |||
* The default value is set to 0.125 mm in 2 hours (0.000125 m in 7200 seconds), which corresponds to '''1.5 mm per day'''. This value is derived from the theory described in 2.3 Gewasverdamping<ref name="GWZ2016"/> in the book Grondwaterzakboekje, which combines the formula of Makkink with a temperature dependent factor<ref name="GWZ2016-2"/> (which is approximately linear between 0 and 24 C). Based on the graph<ref name="GWZ2016-3"/> with plotted lines of reference evaporation for certain months and cloudiness. The evaporation rate was selected as an average of march, june and september, for a cloudy rainy day, which corresponds to a heavy rainfall event. | |||
|seealso= | |||
* [[Water evaporation factor (Water Overlay)]] | |||
* [[Ground evaporation formula (Water Overlay)]] | |||
* [[Surface evaporation formula (Water Overlay)]] | |||
* [[Evaporation model (Water Overlay)]] | |||
|howtos= | |||
* [[How to configure more realistic evaporation rates for a Water Overlay]] | |||
|references= | |||
<references> | |||
<ref name="GWZ2016">2.3 Gewasverdamping, Referentiegewasverdamping, Bram Bot (2016) ∙ Grondwaterzakboekje, Gwz2016 ∙ Impressed druk en print</ref> | |||
<ref name="GWZ2016-2">Tabel 2.3 Benadering van <math>\frac{\Delta}{\Delta + \gamma}</math> en <math>\frac{\gamma}{\Delta + \gamma}</math>, Bram Bot (2016) ∙ Grondwaterzakboekje, Gwz2016 ∙ Impressed druk en print</ref> | |||
<ref name="GWZ2016-3">Fig. 2.7 referentiegewasverdamping, Bram Bot (2016) ∙ Grondwaterzakboekje, Gwz2016 ∙ Impressed druk en print</ref> | |||
</references> | |||
}} | |||
{{WaterOverlay simulation data nav}} | {{WaterOverlay simulation data nav}} | ||
Latest revision as of 10:47, 29 February 2024
| Attribute | Unit | Description |
|---|---|---|
| EVAPORATION_M | end-time, m | An array of values, each pair indicating until what time that period of evaporation will last and what amount evaporates in that period. |
Notes

- A maximum of 10.000 values (5.000 pairs) can be defined.
- Internally each period with amount values are converted to an evaporation rate per second at a particular time in the simulation.
- The default value is set to 0.125 mm in 2 hours (0.000125 m in 7200 seconds), which corresponds to 1.5 mm per day. This value is derived from the theory described in 2.3 Gewasverdamping[1] in the book Grondwaterzakboekje, which combines the formula of Makkink with a temperature dependent factor[2] (which is approximately linear between 0 and 24 C). Based on the graph[3] with plotted lines of reference evaporation for certain months and cloudiness. The evaporation rate was selected as an average of march, june and september, for a cloudy rainy day, which corresponds to a heavy rainfall event.
How-to's
See also
- Water evaporation factor (Water Overlay)
- Ground evaporation formula (Water Overlay)
- Surface evaporation formula (Water Overlay)
- Evaporation model (Water Overlay)
References
- ↑ 2.3 Gewasverdamping, Referentiegewasverdamping, Bram Bot (2016) ∙ Grondwaterzakboekje, Gwz2016 ∙ Impressed druk en print
- ↑ Tabel 2.3 Benadering van en , Bram Bot (2016) ∙ Grondwaterzakboekje, Gwz2016 ∙ Impressed druk en print
- ↑ Fig. 2.7 referentiegewasverdamping, Bram Bot (2016) ∙ Grondwaterzakboekje, Gwz2016 ∙ Impressed druk en print


- Group
- Weather
- Bottom distance • Bottom pressure • Bottom resistance • Ground conductivity • Groundwater datum • Groundwater depth • Manning • Max infiltration • Microrelief • Surface level • Surface u • Surface v • Terrain elevation • Unsaturated fraction
- Elevation
- Elevation
- Related