How to configure more realistic evaporation rates for a Water Overlay
This how-to describes how to obtain more realistic evaporation rates for the Netherlands using historic KNMI weather data. These evaporation rates can be used for the configuration of EVAPORATION_M of a Water Overlay's weather.
Download KNMI Evaporation rate per day
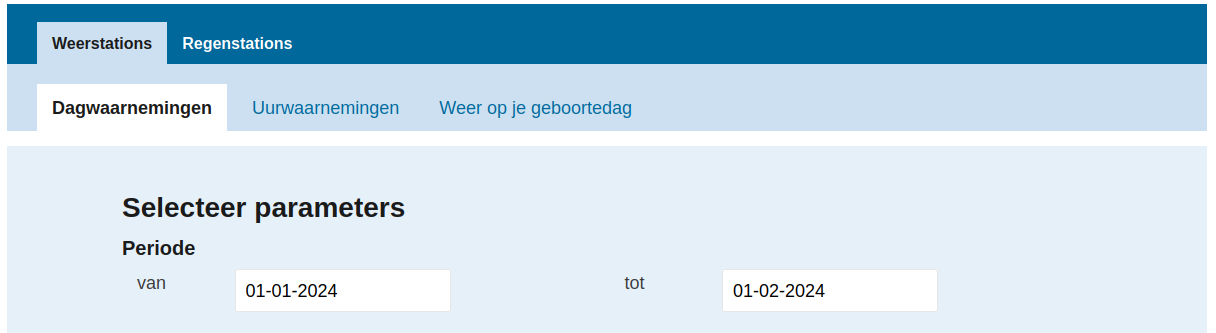
- Go to the website: https://daggegevens.knmi.nl/klimatologie/daggegevens
- First fill in the dates you are interested in, from and to.
- Next, select the checkbox of EV24: Referentiegewasverdamping (Makkink) (in 0.1 mm)
- Now select the weather station closest to your project area.
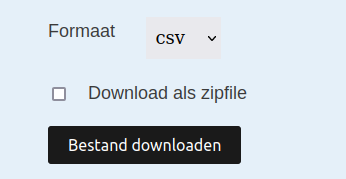
- Make sure the format is set to csv
- Click on the download button, download the csv.
Provide the dates relevant to your Water Overlay's calculation

Select the checkbox for EV24 (the average evaporation rate per day)
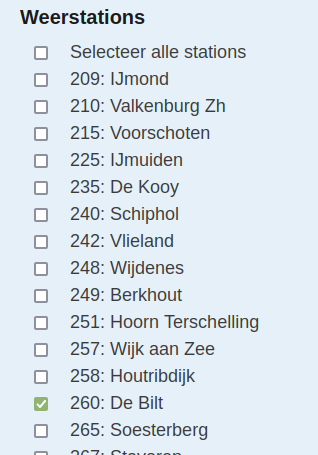
Select the weather station closest to your project area.
Download the result file as a CSV


Correct the KNMI Evaporation rate to mm using Excel
The created csv is not yet ready for use. The evaporation rate has a unit of in 0.1mm. We need to divide it by 10 to obtain it in milimeters. Next, we have to save it as a simpeler csv, without the KNMI descriptions to be able to import the file. We do this by following the how-to below:
- Open the KNMI csv file with an excel editor.
- Add a new sheet to the csv
- In this new sheet, and rename it to evaporation
- Next, select column A1 and edit the formula.
- Select the KNMI data tab, (Most likely named result), and reference cell B9.
- Select the evaporation sheet and select cell A1 again.
- Click on the bottom right of this cell and drag the cell downwards and one column to the right to smart copy the references.
- Select the cell B2 and edit the cell formula.
- Divide the cell reference by 10
- Again, from B2 downwards, smart copy the references divided by 10.
- Now go to File and save this sheet to a csv. Make sure the format is set to .csv.
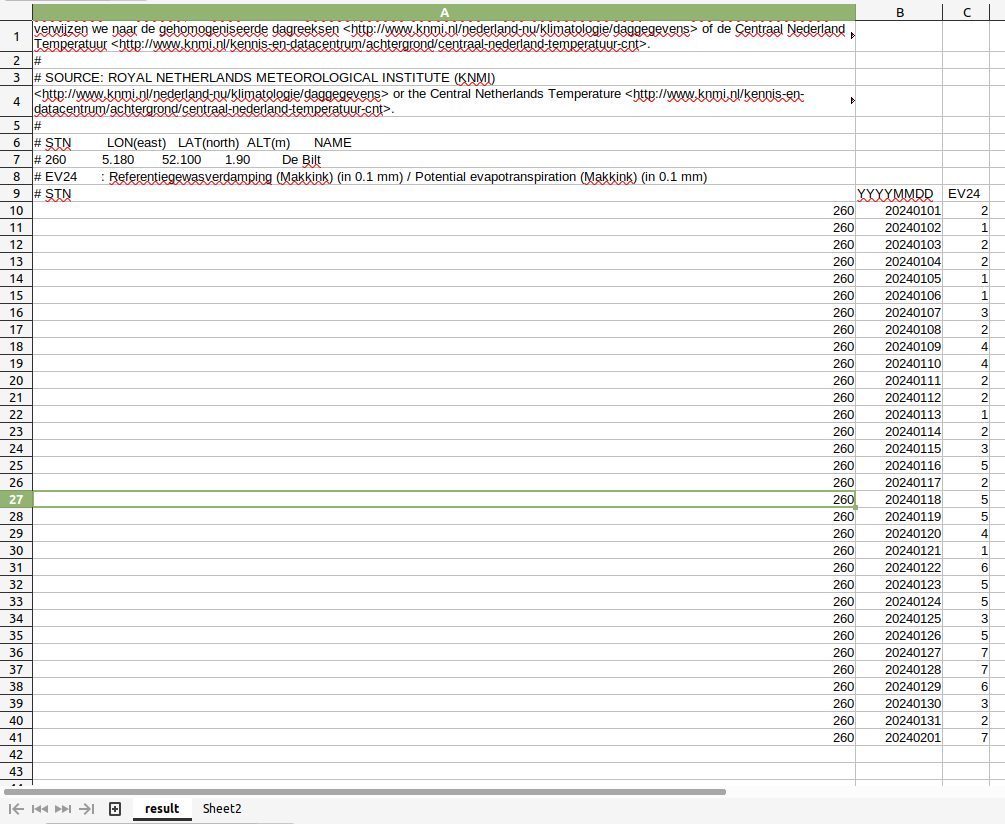
The KNMI result csv opened in an excel editor.
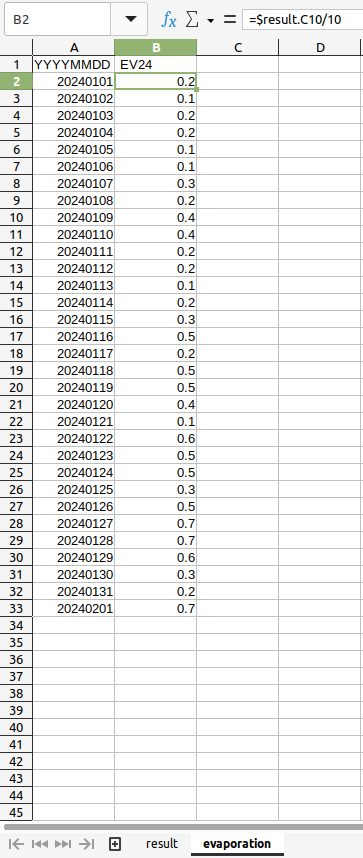
Correcting the evaporation rate in the added evaporation tab.


Adjust the timestamp format for CSV imports
Now that we have a CSV file of the evaporation in mm per date, we can import it for the evaporation rate of the Weather of our Water Overlay. We will first have to verify and optionally set the timestamp format to the one of the KNMI data. We will set the timestamp to yyyyMMdd. The capitalization of the letters matter.
- Open your project as an editing session of the Tygron Platform
- Once loaded, select File in the ribbon bar.
- Select the field next to Timestamp Format.
- Type the timestamp format, in this case yyyyMMdd.

The correct Timestamp Format.

Import the Evaporation rate CSV for a Water Overlay
Now that we have configured the timestamp of our project, we can import the actual evaporation csv.
- Open your project as an editing session of the Tygron Platform
- Once loaded, select Current Situation in the ribbon bar.
- Click on the Overlays button.
- Select the Water Overlay you want to configure this evaporation rate for.
- In the Overlay's Detail Panel, click on the Configuration Wizard button.
- Select or continue to step 1.
- Click on the Custom button next to evaporation over time.
- Click on the import button that under it. This opens in the CSV Import panel.
- First Adjust the import settings to: Comma , TIMESTAMP
- Click on the "Import new CSV" link in the bottom right.
- Select the adjusted evaporation file.
- Inspect the imported file in the table, and verify the correct timestamp and evaporation rate.
- Click on select to configure these values for the evaporation rate of the Water Overlay's Weather.
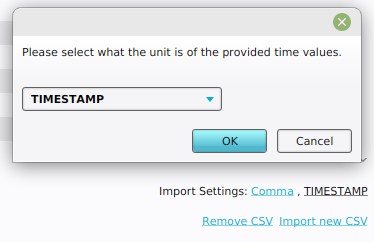
Adjusting the import settings to match Comma and TIMESTAMP.
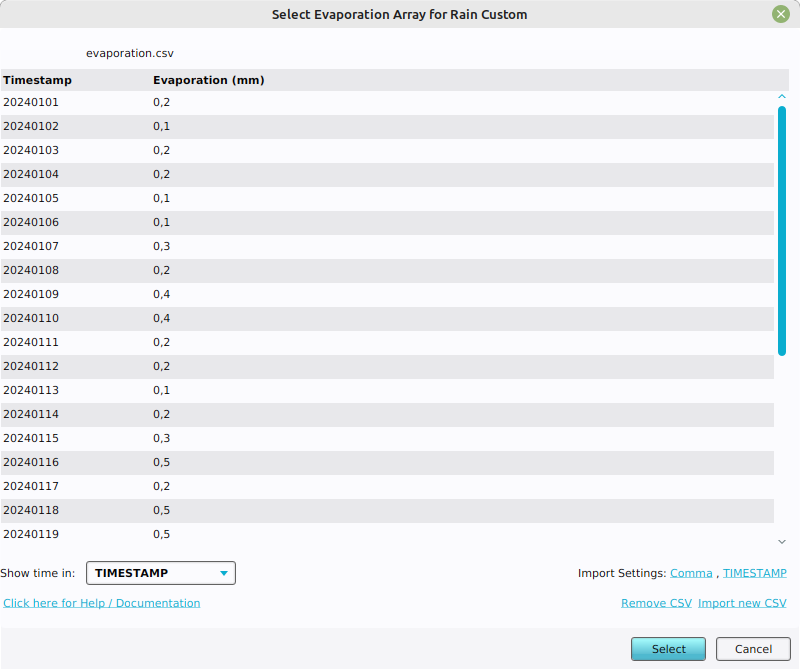
The imported csv with the correct timestamp and evaporation rate.

