Tutorial Heat Stress Project: Difference between revisions
No edit summary |
No edit summary |
||
| Line 1: | Line 1: | ||
The Heat Stress Overlay allows users to visualize a generated Physiological Equivalent Temperature (PET) overlay, along with other intermediate overlay results. The Heat Stress Overlay can be configured using the Wizard. | The Heat Stress Overlay allows users to visualize a generated Physiological Equivalent Temperature (PET) overlay, along with other intermediate overlay results. The Heat Stress Overlay can be configured using the Wizard. | ||
Using this tutorial you can | Using this tutorial, you can set up a new [[Heat Stress Overlay]] in the Heat Stress Tutorial project using the Heat Stress Overlay Wizard. This project was selected so you can compare its outcome with the Demo Heat Stress project. | ||
==Getting Started== | ==Getting Started== | ||
* Open the {{software}} | * Open the {{software}} and log in with your username and password. | ||
* Choose the Tutorial Heat Stress project in edit projects. | * Choose the Tutorial Heat Stress project in edit projects. | ||
| Line 26: | Line 26: | ||
* Click on "Next" in the Introduction of the Wizard. | * Click on "Next" in the Introduction of the Wizard. | ||
* | * You can now see the configuration steps. | ||
{{clear|both}} | {{clear|both}} | ||
| Line 39: | Line 39: | ||
In Step 2 ''Select Days'' you can select the start and end date for the PET calculation, also the specific hours. Additional parameters can also be adjusted for the specific hours and days given. | In Step 2 ''Select Days'' you can select the start and end date for the PET calculation, also the specific hours. Additional parameters can also be adjusted for the specific hours and days given. | ||
* By default August 2nd, 2013 is selected. You can also choose to select multiple consecutive days when using the Heat Stress Overlay Wizard. | * By default August 2nd, 2013 is selected. You can also choose to select multiple consecutive days when using the Heat Stress Overlay Wizard. | ||
* Select Edit and configure the hours you want to generate results for: Select every hour from 12:00 to 18:00 | * Select Edit and configure the hours you want to generate results for: Select every hour from 12:00 to 18:00. Each day-hour combination will become a result. This result is stored as a time-frame to relate it back to the day and time. For each day, and for each time of day, the following will be automatically generated when using the wizard. You can also select a new start and end date, but you must import your own data. For instructions, see the [[Tutorial_Heat_Overlay_(Heat_Overlay)#Supply_daily_and_hourly_weather_station_data|Supply daily and hourly weather station data]] section. Use the default settings to allow comparison with the Demo Heat Stress project. | ||
* Select Next. | * Select Next. | ||
Step 2.1 ''Hour Values'' The day and time pairs, along with the project location, will be used to automatically calculate the [[Sun_altitude_(Heat_Overlay)|sun altitude]] and [[Sun_azimuth_(Heat_Overlay)|sun azimuth angles]] for each day-time pair. If desired you can add a subsequent hour to the list by clicking ''Add Hour''. | Step 2.1 ''Hour Values'' The day and time pairs, along with the project location, will be used to automatically calculate the [[Sun_altitude_(Heat_Overlay)|sun altitude]] and [[Sun_azimuth_(Heat_Overlay)|sun azimuth angles]] for each day-time pair. If desired you can add a subsequent hour to the list by clicking ''Add Hour''. | ||
| Line 55: | Line 55: | ||
===Supply daily and hourly weather station data=== | ===Supply daily and hourly weather station data=== | ||
By default you see an overview of the weather station data of August 2nd 2013. To learn more about how to upload weather station data go to [[KNMI weather data]] and the [[How to import KNMI weather data into Microsoft Excel]] page. Download historical hourly weather data for your project area in the Netherlands and use specific columns as input. | By default you see an overview of the weather station data of August 2nd 2013. To learn more about how to upload weather station data go to [[KNMI weather data]] and the [[How to import KNMI weather data into Microsoft Excel]] page. Download historical hourly weather data for your project area in the Netherlands and use specific columns as input. Using the weather data, you must provide both daily and hourly values. Check the links below to learn how you can supply these. An explanation is provided for each value to assist with data collection for international projects. | ||
* [[How to calculate the hourly radiation]] | * [[How to calculate the hourly radiation]] | ||
| Line 66: | Line 66: | ||
=== Step 3: Foliage === | === Step 3: Foliage === | ||
In step 3 ''Foliage height'' you can define how to treat the foliage in your project. You can | In step 3 ''Foliage height'' you can define how to treat the foliage in your project. You can set up how the foliage height and crown factor behave, and whether or not you want to visualize foliage in the Heat Stress Overlay. Select what source will define the foliage height, you have three options: | ||
# Buildings with [[Function|functions]] related to foliage. The [[Foliage_height_calculation_model_(Heat_Overlay)|foliage height calculation model]] | # Buildings with [[Function|functions]] related to foliage. The [[Foliage_height_calculation_model_(Heat_Overlay)|foliage height calculation model]] determines the foliage height using the height of the vegetation (modeled as buildings) and the foliage crown factor attribute. This option allows users to experiment with future design scenarios by using actions, measures, and upgrades. For more information on how to adjust this option go to [[How_to_adjust_the_foliage_height_and_crown_factor|How to adjust the foliage height and crown factor]]. | ||
# Areas with a foliage height attribute | # Areas with a foliage height attribute define the foliage height for a whole area. For more information, see [[How_to_import_foliage_height_areas|How to import foliage height areas]]. | ||
# [[GeoTIFF]], defining a foliage height value for each cell in its raster. This is the most precise | # [[GeoTIFF]], defining a foliage height value for each cell in its raster. This is the most precise method for applying this data. For more information on how to adjust this option go to [[How_to_import_a_foliage_height_GeoTIFF|How to import a foliage height GeoTIFF]]. <br> | ||
* For this tutorial, choose ''Use tree Function's height and foliage crown factor'' and click Next. <br> | * For this tutorial, choose ''Use tree Function's height and foliage crown factor'' and click Next. <br> | ||
Step 3.1 Foliage Functions<br> | Step 3.1 Foliage Functions<br> | ||
In this step you can edit the Function Values of the different types of trees. By default six types of trees are present in the Platform and each have their own specific Foliage Crown Factor. If you have imported your own foliage data you can edit the Function Values in this step manually, | In this step you can edit the Function Values of the different types of trees. By default six types of trees are present in the Platform and each have their own specific Foliage Crown Factor. If you have imported your own foliage data you can edit the Function Values in this step manually, as imported data typically includes the correct foliage crown factor. When you want to adjust the Function Value please select the Nature Category with the Group Filter Environment to get an overview of the different types of trees. | ||
* For this tutorial, do nothing and select Next. <br> | * For this tutorial, do nothing and select Next. <br> | ||
Step 3.2 Visualize Crown Factor<br> | Step 3.2 Visualize Crown Factor<br> | ||
In this step you can select a checkbox that will provide you with insight on what kind of input values the Heat model uses. This is displayed in an | In this step you can select a checkbox that will provide you with insight on what kind of input values the Heat model uses. This is displayed in an overlay of the foliage crown factor. | ||
*Select the Foliage Crown Factor checkbox and select Next. | *Select the Foliage Crown Factor checkbox and select Next. | ||
| Line 90: | Line 90: | ||
=== Step 4: Overlays === | === Step 4: Overlays === | ||
In the final step you can choose which result types you want to display in the Overlay. The PET (Physiological Equivalent Temperature) is a commonly used result, although requirements vary by project. Choose all output overlays to | In the final step you can choose which result types you want to display in the Overlay. The PET (Physiological Equivalent Temperature) is a commonly used result, although requirements vary by project. Choose all output overlays to gain insight into the different components that configure the PET. For an overview of the different result types and their meanings go to [[Result_types_ (Heat_Overlay)|Result types (Heat_Overlay)]]. | ||
* Select the 'First' checkbox to set the parent overlay; all other selected overlays will appear as child overlays. In this case we select at least the PET (Physiological Equivalent Temperature) overlay as First. | * Select the 'First' checkbox to set the parent overlay; all other selected overlays will appear as child overlays. In this case we select at least the PET (Physiological Equivalent Temperature) overlay as First. | ||
* Select the child overlays, in this case the [[Foliage result type (Heat Stress Overlay)|Foliage]], [[Bowen ratio _result type (Heat Stress Overlay)|Bowen Ratio]], [[Shade result type (Heat Stress Overlay)|Shade]], [[Sky view result type (Heat Stress Overlay)|Sky view]], [[Uhi result type (Heat Stress Overlay)|Urban Heat Island]] and [[Wind speed (Heat Stress Overlay)|Wind Speed]]. | * Select the child overlays, in this case the [[Foliage result type (Heat Stress Overlay)|Foliage]], [[Bowen ratio _result type (Heat Stress Overlay)|Bowen Ratio]], [[Shade result type (Heat Stress Overlay)|Shade]], [[Sky view result type (Heat Stress Overlay)|Sky view]], [[Uhi result type (Heat Stress Overlay)|Urban Heat Island]] and [[Wind speed (Heat Stress Overlay)|Wind Speed]]. | ||
*Select ''Finish'' to close the Wizard. You have successfully | *Select ''Finish'' to close the Wizard. You have successfully set up your Heat Stress Overlay. | ||
<gallery mode="nolines"> | <gallery mode="nolines"> | ||
| Line 100: | Line 100: | ||
</gallery> | </gallery> | ||
*If no results are | *If no results are shown in your overlays, recalculate the outcomes to display them. If that's the case, please click the recalculated button in the upper left corner as you can see in the picture below. All outcomes will be recalculated and displayed now. | ||
<gallery mode="nolines"> | <gallery mode="nolines"> | ||
| Line 109: | Line 109: | ||
[[File:Heat overlaysth.PNG|thumb|right|250px|Heat Stress Overlay]][[File:Shade Wageningenth.PNG|thumb|right|250px|Shade Overlay]] | [[File:Heat overlaysth.PNG|thumb|right|250px|Heat Stress Overlay]][[File:Shade Wageningenth.PNG|thumb|right|250px|Shade Overlay]] | ||
In this part of the tutorial we will give you some suggestions on how to adjust more settings and results. Hover over the Heat Stress Overlay on the right and its different child overlays. | In this part of the tutorial we will give you some suggestions on how to adjust more settings and results. Hover over the Heat Stress Overlay on the right and its different child overlays. | ||
* You can run through the different time frame results by using the arrows in the Left corner of the [[viewer ]]interface. | * You can run through the different time frame results by using the arrows in the Left corner of the [[viewer]] interface. | ||
* Can you improve your result even further by uploading detailed Foliage data? | * Can you improve your result even further by uploading detailed Foliage data? | ||
* Check the Shade child overlay. You can for example clearly see the impact of the high building in ''Buitenwijk Wageningen Oost''. | * Check the Shade child overlay. You can for example clearly see the impact of the high building in ''Buitenwijk Wageningen Oost''. | ||
* Note that you can change the grid size of your calculation by choosing (Change Grid) in the middle of the right column in your screen. Change it from 10m to 1 m and inspect the result. As a result the black grid cells of the buildings will become more accurate in your overlay and more | * Note that you can change the grid size of your calculation by choosing (Change Grid) in the middle of the right column in your screen. Change it from 10m to 1 m and inspect the result. As a result the black grid cells of the buildings will become more accurate in your overlay and more similar to the 'HitteWageningen' project. | ||
{{clear|both}} | {{clear|both}} | ||
Latest revision as of 11:41, 15 July 2026
The Heat Stress Overlay allows users to visualize a generated Physiological Equivalent Temperature (PET) overlay, along with other intermediate overlay results. The Heat Stress Overlay can be configured using the Wizard.
Using this tutorial, you can set up a new Heat Stress Overlay in the Heat Stress Tutorial project using the Heat Stress Overlay Wizard. This project was selected so you can compare its outcome with the Demo Heat Stress project.
Getting Started
- Open the Tygron Platform and log in with your username and password.
- Choose the Tutorial Heat Stress project in edit projects.
-
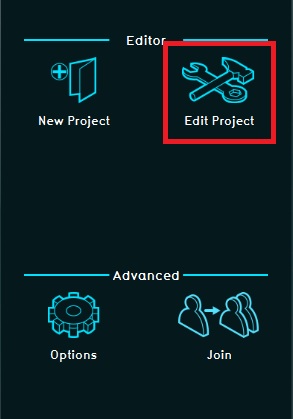 Edit projects in main menu
 -
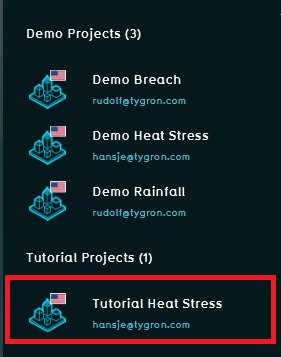 Tutorial Heat Stress project


Add Heat Stress Overlay

Hover over the button Overlays, in the Current situation tab and select Add Heat Stress.
The Heat Stress Overlay is added to the Overlays in the left-side-panel, and in the overlay bar on the right side of the map.
Configure Wizard
- Open the Wizard by clicking on the "Configuration Wizard" button on the right panel

- Click on "Next" in the Introduction of the Wizard.
- You can now see the configuration steps.
Step 1: Select model
In Step 1 you can choose either the new (more accurate) DPRA Heat Stress Module or the UNESCO Heat stress module that was used in previous releases of the Tygron Platform.
- For this tutorial select the DPRA Model.
-
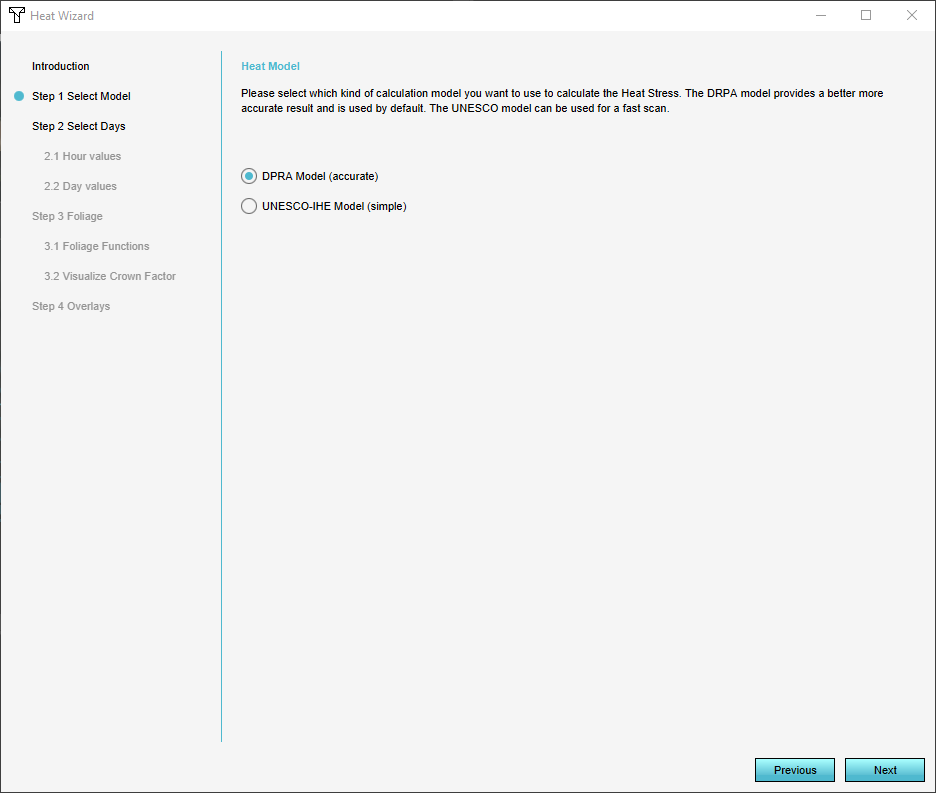 Step 1 Select model

Step 2: Choose date and time of day
In Step 2 Select Days you can select the start and end date for the PET calculation, also the specific hours. Additional parameters can also be adjusted for the specific hours and days given.
- By default August 2nd, 2013 is selected. You can also choose to select multiple consecutive days when using the Heat Stress Overlay Wizard.
- Select Edit and configure the hours you want to generate results for: Select every hour from 12:00 to 18:00. Each day-hour combination will become a result. This result is stored as a time-frame to relate it back to the day and time. For each day, and for each time of day, the following will be automatically generated when using the wizard. You can also select a new start and end date, but you must import your own data. For instructions, see the Supply daily and hourly weather station data section. Use the default settings to allow comparison with the Demo Heat Stress project.
- Select Next.
Step 2.1 Hour Values The day and time pairs, along with the project location, will be used to automatically calculate the sun altitude and sun azimuth angles for each day-time pair. If desired you can add a subsequent hour to the list by clicking Add Hour.
- If all hours are correct select Next.
Step 2.2 Day Values The sun daily motion factor is a parameter used in the atmospheric temperature formula. It will be automatically selected from the sun motion factor table, based on the date (column) and time of day (row).
- Now you see an overview of the sun angle at each time of day and other relevant factors. To find out more about the attributes and the impact they have on the overall system go to Heat Stress Overview.
- Select next.
-
 Step 2 Select days and hours
 -
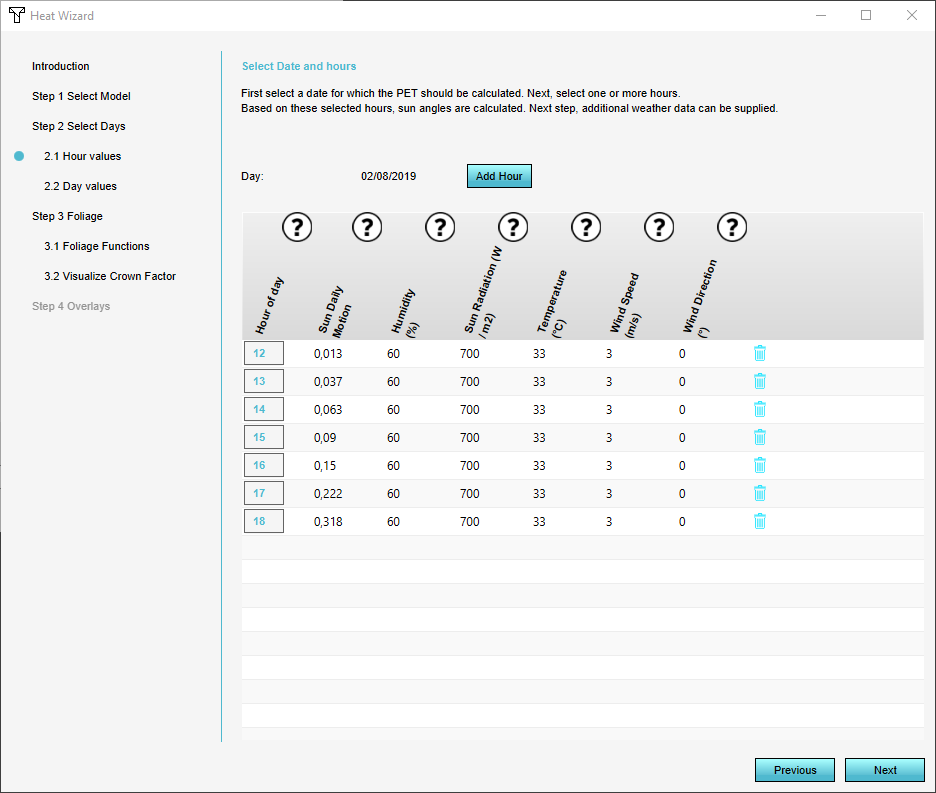 Step 2.1 Configure hours
 -
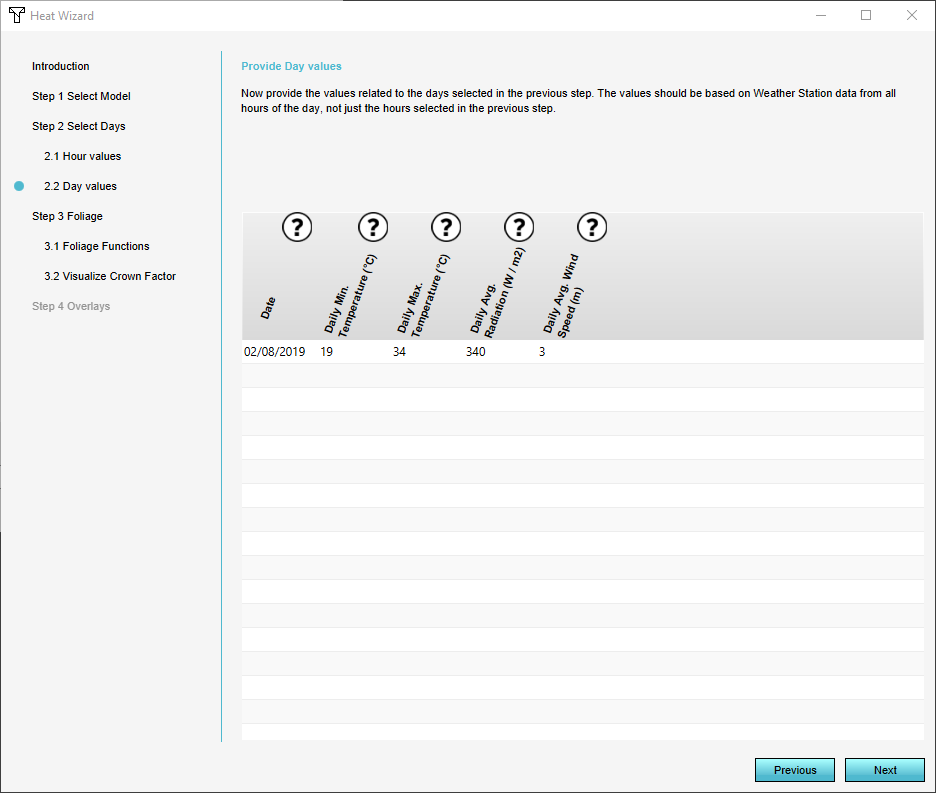 Step 2.2 Weather Station data


Supply daily and hourly weather station data
By default you see an overview of the weather station data of August 2nd 2013. To learn more about how to upload weather station data go to KNMI weather data and the How to import KNMI weather data into Microsoft Excel page. Download historical hourly weather data for your project area in the Netherlands and use specific columns as input. Using the weather data, you must provide both daily and hourly values. Check the links below to learn how you can supply these. An explanation is provided for each value to assist with data collection for international projects.
- How to calculate the hourly radiation
- How to calculate the hourly humidity
- How to calculate the hourly wind direction
- How to calculate the hourly wind speed
- How to calculate the daily average wind speed
- How to calculate the daily min and max temperature
- How to calculate the daily average radiation
Step 3: Foliage
In step 3 Foliage height you can define how to treat the foliage in your project. You can set up how the foliage height and crown factor behave, and whether or not you want to visualize foliage in the Heat Stress Overlay. Select what source will define the foliage height, you have three options:
- Buildings with functions related to foliage. The foliage height calculation model determines the foliage height using the height of the vegetation (modeled as buildings) and the foliage crown factor attribute. This option allows users to experiment with future design scenarios by using actions, measures, and upgrades. For more information on how to adjust this option go to How to adjust the foliage height and crown factor.
- Areas with a foliage height attribute define the foliage height for a whole area. For more information, see How to import foliage height areas.
- GeoTIFF, defining a foliage height value for each cell in its raster. This is the most precise method for applying this data. For more information on how to adjust this option go to How to import a foliage height GeoTIFF.
- For this tutorial, choose Use tree Function's height and foliage crown factor and click Next.
Step 3.1 Foliage Functions
In this step you can edit the Function Values of the different types of trees. By default six types of trees are present in the Platform and each have their own specific Foliage Crown Factor. If you have imported your own foliage data you can edit the Function Values in this step manually, as imported data typically includes the correct foliage crown factor. When you want to adjust the Function Value please select the Nature Category with the Group Filter Environment to get an overview of the different types of trees.
- For this tutorial, do nothing and select Next.
Step 3.2 Visualize Crown Factor
In this step you can select a checkbox that will provide you with insight on what kind of input values the Heat model uses. This is displayed in an overlay of the foliage crown factor.
- Select the Foliage Crown Factor checkbox and select Next.
-
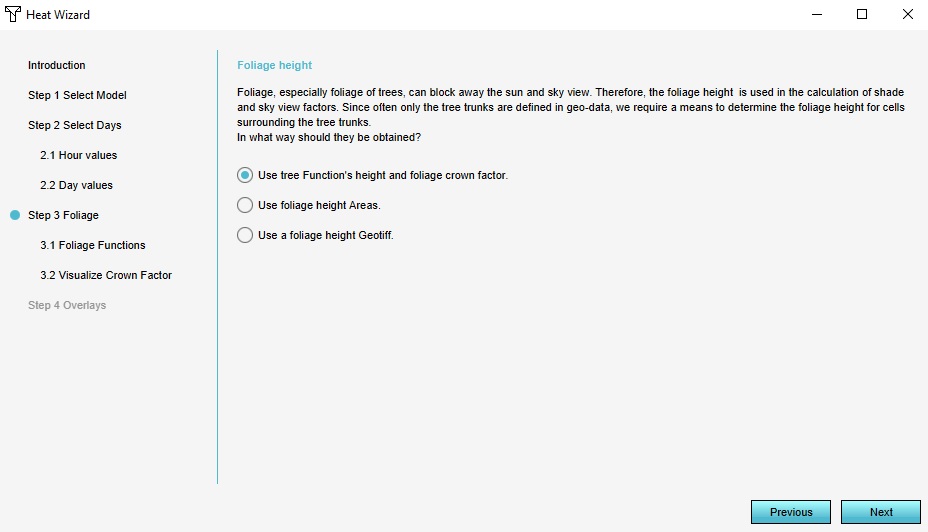 Step 3 Foliage height
 -
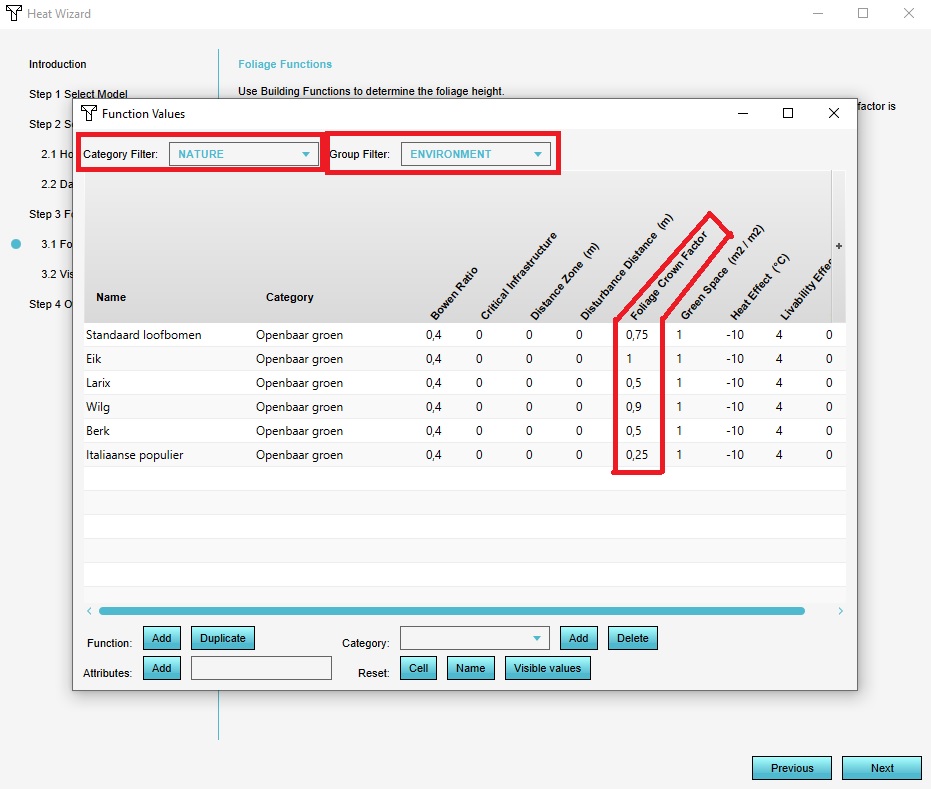 Step 3.1 Foliage Functions
 -
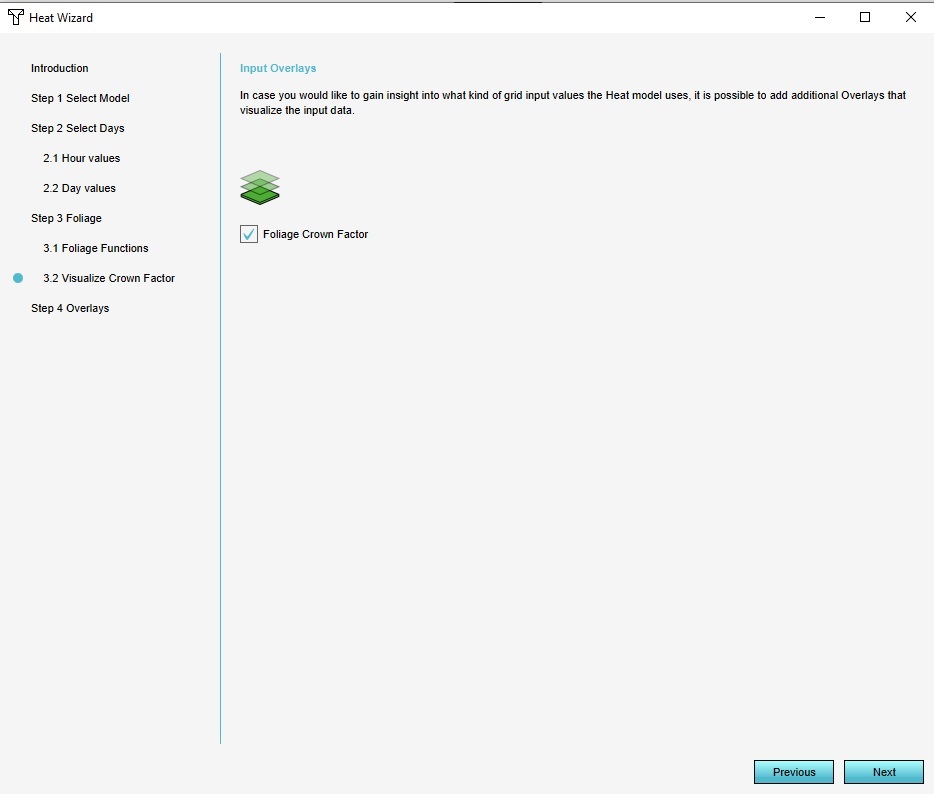 Step 3.2 Visualize Crown Factor


Step 4: Overlays
In the final step you can choose which result types you want to display in the Overlay. The PET (Physiological Equivalent Temperature) is a commonly used result, although requirements vary by project. Choose all output overlays to gain insight into the different components that configure the PET. For an overview of the different result types and their meanings go to Result types (Heat_Overlay).
- Select the 'First' checkbox to set the parent overlay; all other selected overlays will appear as child overlays. In this case we select at least the PET (Physiological Equivalent Temperature) overlay as First.
- Select the child overlays, in this case the Foliage, Bowen Ratio, Shade, Sky view, Urban Heat Island and Wind Speed.
- Select Finish to close the Wizard. You have successfully set up your Heat Stress Overlay.

- If no results are shown in your overlays, recalculate the outcomes to display them. If that's the case, please click the recalculated button in the upper left corner as you can see in the picture below. All outcomes will be recalculated and displayed now.

Explore your results


In this part of the tutorial we will give you some suggestions on how to adjust more settings and results. Hover over the Heat Stress Overlay on the right and its different child overlays.
- You can run through the different time frame results by using the arrows in the Left corner of the viewer interface.
- Can you improve your result even further by uploading detailed Foliage data?
- Check the Shade child overlay. You can for example clearly see the impact of the high building in Buitenwijk Wageningen Oost.
- Note that you can change the grid size of your calculation by choosing (Change Grid) in the middle of the right column in your screen. Change it from 10m to 1 m and inspect the result. As a result the black grid cells of the buildings will become more accurate in your overlay and more similar to the 'HitteWageningen' project.
Further reading
To read more documentation about the Heat Stress Overlay explore the DPRA Heat Stress Module documentation.



- Group
- Model attributes
- Daily average radiation • Daily average wind speed • Daily maximum temperature • Daily minimum temperature • Dates • Exclude buildings • Exclude water • Exclude foliage height m • Foliage areas • Hourly humidity • Hourly radiation • Hourly temperature • Max shadow distance • Max trunk distance • Sun altitude • Sun azimuth • Sun daily motion • Wind direction • Wind speed • Wind decline angle
- Group
- Building attributes
- Bowen ratio • Foliage height • Foliage crown factor • Vegetation fraction
- Terrain attributes
- Bowen ratio • Vegetation fraction
- Area attributes
- Foliage height
- Group
- Prequels
- Building elevation • Foliage height • Terrain elevation
- Related