Demo Ww Agriculture Project: Difference between revisions
mNo edit summary |
No edit summary |
||
| (49 intermediate revisions by 4 users not shown) | |||
| Line 1: | Line 1: | ||
{{unavailable}} | |||
{{demo project summary | {{demo project summary | ||
| title=Demo Ww Agriculture | | title=Demo Ww Agriculture | ||
| demographic=waterboards, urban planners in rural environments, and agricultural engineers | | demographic=waterboards, urban planners in rural environments, and agricultural engineers | ||
| showcases=the results of the Waterwijzer's calculations spatially, through the connection with their API | | showcases=the results of the [https://waterwijzerlandbouw.wur.nl/ Waterwijzer]'s calculations spatially, through the connection with their API | ||
| description=The demo is a project in which a location in The Netherlands used for agriculture, and with a variation of underground [[Terrain Type]]s and groundwater levels. The [[Waterwijzer Overlay]] provides insight into how to what degree | | description=The demo is a project in which a location in The Netherlands used for agriculture, and with a variation of underground [[Terrain Type]]s and groundwater levels. The [[Waterwijzer Overlay]] provides insight into how to what degree yield is lost as a result of hydrological conditions in the soil and subsoil. | ||
| image= | |||
This demo demonstrates the functionality of the [[Waterwijzer Overlay]]. For instructions on applying the [[Waterwijzer Overlay]] in your own [[Project]], see the {{inlink|How-to's}} section. | |||
| image=WWz yield loss.jpg | |||
}} | }} | ||
==Exploring the project== | ==Exploring the project== | ||
To begin exploring the project, take the following steps: | To begin exploring the project, take the following steps: | ||
# Click anywhere in the 3D | # Click anywhere in the [[3D Visualization]], and use the arrow keys on your keyboard to move the [[Camera]] around. You can also move the camera with the mouse; See [[Camera#Standard]]. | ||
# On the right-hand side of the [[viewer ]]interface you can see the [[navigation panel]], which shows a list of [[overlay]] icons. Hover over the various icons to see a tooltip with their name. Find the Overlay named "Waterwijzer yield loss", and click on it. This will show the Overlay in the 3D Visualization. This Overlay shows the yield loss as a result of hydrological conditions. | |||
# At the bottom of the [[Viewer ]]interface a legend will now appear. The legend relates the meaning of the various colors in the [[3D Visualization]] to the specific underlying values. | |||
# Hover over the icon for the Overlay again, and notice that more options appear for Overlays related to the same calculation. These are the child overlays, which can display [[result type (Waterwijzer Overlay)|more specific types of results]] from the Waterwijzer calculation. | |||
# Notice that other Overlays exist as well, to provide more insight: | |||
## An [[Underground Overlay]] to show the underground [[Terrain Type]]s. It has two child Overlays providing insight into the default values for groundwater: "NHI GLG" for the lowest groundwater levels, and "NHI GHG" for the highest groundwater levels. | |||
## A "Subsidence Waterwijzer yield loss" [[Overlay]], which performs the same calculation as the "Waterwijzer yield loss" [[Overlay]], but includes the effects of a separate subsidence calculation. There is also a [[Subsidence Overlay]] which provides that input through its [[Child Overlay]]s. | |||
# At the top of the the [[viewer ]]interface you can see the [[top bar]]. Click on any of the [[Indicator]]s to open an [[indicator panel]] with information on how a score for the [[Project]] is determined. | |||
## The "Lost yield" [[Indicator]] shows how many crops are damaged, causing potential yield to be lost. The greater the percentage of yield loss is, the lower the state of the project area scores. When the average amount of damage across the entire project area exceeds 50%, the score is 0. A few farmer's parcels are listed as well for a more detailed perspective on those parcels. The data underpinning this [[Indicator]] is taken directly from the "Waterwijzer yield loss" [[Overlay]]. | |||
## The "Lost (subsidence)" [[Indicator]] performs the same calculation, but makes use of the "Subsidence Waterwijzer yield loss" [[Overlay]] instead. This means these results and scores take the effects of subsidence into account, and more actions can affect it. | |||
# Finally, notice a number of icons floating in the [[3D Visualization]]. | |||
## The blue icons denote points-of-interest for the [[Waterwijzer Overlay]] which you can take a closer look at. You can click on any to open a panel with more information. | |||
## The orange icon denotes a location where an action can be taken for the [[Subsidence Overlay]], which in turn affects the "Subsidence Waterwijzer yield loss". | |||
==Points of interest== | |||
The project features a number of points of interest displaying specific features or phenomenons relevant to understanding what can affect the [[Waterwijzer Overlay]]'s calculations. | |||
===Soil=== | |||
[[File:demo_ww_agriculture_soil.jpg|left]] | |||
Multiple types of underground terrain are present in this project area. Different subsoil types lead to different results due to the variance in water retention and subsurface flow potential. | |||
In this demo project, the difference in soil type has been exaggerated to show more clearly how different soil types lead to different results. | |||
Clicking on the popup will show the Underground Overlay, which shows what [[Terrain Type]]s make up the underground. | |||
{{editor location|terrain}} | |||
When a project is first created, [[Terrain]]s are automatically loaded in based on publicly available data. Each [[Terrain Type|type of terrain]] features a [[Brp code (Waterwijzer Overlay)|BRP code]] as an [[Attribute]], which is used as an input parameter for the Waterwijzer. | |||
{{clear}} | |||
===Groundwater=== | |||
[[File:demo_ww_agriculture_groundwaterlevel.jpg|left]] | |||
In locations with very low or very high groundwater levels, more damage is done to the plants above ground. Either due to a lack of water causing the plants to dry out, or an excessive amount of water, causing oxygen deprivation. In other words, the underground may be too wet or too dry. | |||
However, as the underground terrain changes, the effects of the groundwater change as well. This is due in part because of measured groundwater levels differing geographically in correlation with the subsoil, but also because the flow of the water is the subsoil will differ, which in turn affects the plants. | |||
Clicking on the popup will show the relevant yield loss Overlay, which shows the percentage of crops lost due to the hydrological circumstances. | |||
{{editor location|overlay wizard|Waterwijzer Overlay|Step on Groundwater}} | |||
Clicking on either popup will show the [[Damage wet result type (Waterwijzer Overlay)|oxygen deprivation]] or [[Damage dry result type (Waterwijzer Overlay)|drought]] result type [[Child Overlay]], which shows the yield loss caused by that phenomenon specifically. | |||
{{clear}} | |||
===Crops=== | |||
[[File:demo_ww_agriculture_crops.jpg|left]] | |||
Different crops thrive under different circumstances. A soil type and a groundwater level which suits one type of crops will not be sufficient for another. | |||
This area is mostly filled with grassland, but also includes a number of parcels with corn. Both types of crops prefer their own hydrological circumstances. | |||
{{editor location|building|The crops to edit|right-panel=Attributes tab}} | |||
{{clear}} | |||
===Accuracy=== | |||
[[File:demo_ww_agriculture_accuracy.jpg|left]] | |||
Although calculations can be performed with a high accuracy, in the end the results can only be as accurate as the provided data. Because this project uses the default NHI groundwater dataset, with an accuracy of 25m, the results of the calculation will show blocks of similar accuracy. | |||
If you use this Overlay, and have more accurate groundwater data to load in, the results will become more accurate as well. | |||
{{editor location|overlay wizard|Waterwijzer Overlay|Step on Groundwater}} | |||
{{clear}} | |||
===Subsidence=== | |||
[[File:demo_ww_agriculture_subsidence.jpg|left]] | |||
When the Overlay is linked to the Subsidence Overlay, actions affecting the rate of subsidence will also affect the groundwater levels, and thus the calculation of the yield loss. | |||
{{editor location|overlay|Subsidence Overlay}} | |||
{{clear}} | |||
==Actions== | |||
[[File:Editor ribbon bar testrun active.jpg|left]] | |||
After inspecting the results of the calculations based on the data present in the project, it is also possible to explore the effects of actions taken in the area. Note that when any of the actions described here are taken, a [[Test Run]] will start automatically. | |||
{{editor location|testrun}} | |||
This means the editing tools will be temporarily disabled. When you are done experimenting with actions, you can stop the test run by clicking the stop button in the ribbon. This will revert the session back to its base state, without the effects of the applied action(s).{{clear}} | |||
===Spatial actions=== | |||
[[File:demo_ww_agricultiure_menus.jpg|left|350px]] | |||
There are a number of spatial [[Action]]s which can affect the results of the calculation of the yield loss. It is possible to change the types of crops grown in the project area, or to place drainage in predefined locations to change the groundwater levels. | |||
Switch to the "Future design" tab, and then in the [[Viewer ]]interface the [[Action Menu]] will appear. This menu allows you make changes to the [[project]]. | |||
Open the menu of "Parcel changes", and select the "Drainage with Onions" [[Measure]]. A selection will appear in the [[3D Visualization]] where a predefined change will be made. Click on "Apply". This will perform the [[Measure]]. The eastern farmer's parcel's crops will be entirely replaced by a new crop type. | |||
Open either of the [[Indicator]]s by clicking on them in the [[top bar]]. Take note of the yield loss in the current situation, and in the planned situation. The difference is caused by the [[Action]] taken. | |||
Open either of the yield loss Overlays too. Now in the [[Top bar]], find the "display" option, and select the "Original" mode. This will display the results of the original calculation. Switch between the "Original" and "Planned" display modes to see how the results have changed. | |||
Open the menu of "Free actions", and select the "Demolish" [[Action]]. You will be able to draw a selection in the [[3D Visualization]] to remove existing crops. Make a selection by clicking on one or more parcels in the [[3D Visualization]], and then click on "Apply". | |||
Next, in the "Free actions" menu, select the "Onions" [[Action]]. You will be able to draw a selection in the [[3D Visualization]] to place new crop. Make a selection by click-and-dragging in the location cleared by the earlier demolition action. Then click on "Apply". | |||
Open either of the [[Indicator]]s by clicking on them in the [[top bar]]. Take note of the yield loss in the current situation, and in the planned situation. The difference is caused by the [[Action]] taken. | |||
{{clear}} | |||
===Indexation=== | |||
[[File:demo_ww_agricultiure_indexation.jpg|left]] | |||
[[File:WW index control.PNG|thumb|right|300px|The Panel for changing the indexation, affecting the rate of subsidence and the resulting groundwater levels.]] | |||
Find the orange popup in the [[3D Visualization]], and click it to open the related panel. It features a bit of information, and an input field where the "indexation" setting can be changed. Set it to "1", and submit the new setting by clicking the button. The [[Subsidence Overlay]] will recalculate, resulting in new groundwater levels. The "Subsidence Waterwijzer yield loss" [[Overlay]] will use those new groundwater levels to recalculate yield losses. | |||
Switch to the "Future design" tab, and then in the [[Viewer ]]interface the [[top bar]] will show the "display" option. By switching between the "Original" and "Planned" options, it's possible to compare the effect of changing the indexation on the yields. | |||
{{clear}} | |||
{{article end | |||
|seealso= | |||
* [[List of Demo Projects]] | |||
|howtos= | |||
* [[How to add the Waterwijzer Overlay]] | |||
* [[How to configure the Waterwijzer Overlay to use groundwater results from other calculations]] | |||
}} | |||
{{WaterwijzerOverlay_demo_nav}} | |||
Latest revision as of 14:33, 13 December 2023
The Demo Ww Agriculture project is available for all users and can be found in the main menu under Edit projects. This project does not count towards your license.
This project is intended for waterboards, urban planners in rural environments, and agricultural engineers.
This project showcases the results of the Waterwijzer's calculations spatially, through the connection with their API.
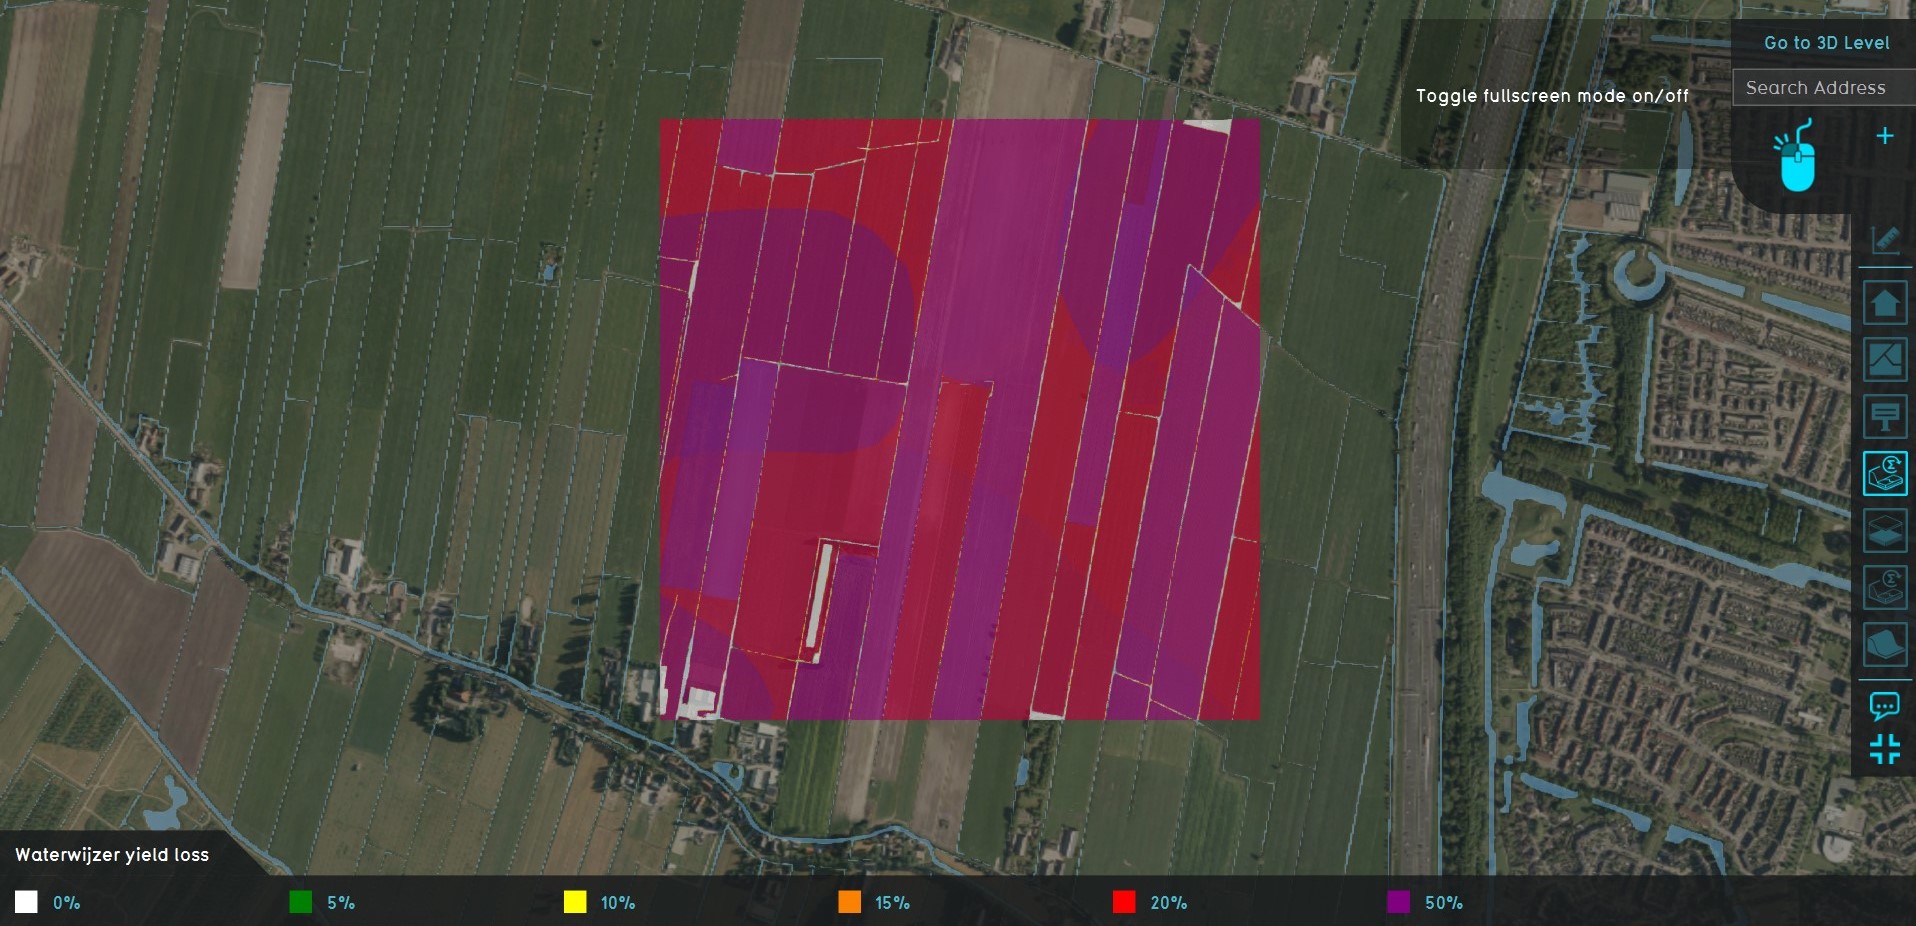
The demo is a project in which a location in The Netherlands used for agriculture, and with a variation of underground Terrain Types and groundwater levels. The Waterwijzer Overlay provides insight into how to what degree yield is lost as a result of hydrological conditions in the soil and subsoil.
This demo demonstrates the functionality of the Waterwijzer Overlay. For instructions on applying the Waterwijzer Overlay in your own Project, see the How-to's section.
Exploring the project
To begin exploring the project, take the following steps:
- Click anywhere in the 3D Visualization, and use the arrow keys on your keyboard to move the Camera around. You can also move the camera with the mouse; See Camera#Standard.
- On the right-hand side of the viewer interface you can see the navigation panel, which shows a list of overlay icons. Hover over the various icons to see a tooltip with their name. Find the Overlay named "Waterwijzer yield loss", and click on it. This will show the Overlay in the 3D Visualization. This Overlay shows the yield loss as a result of hydrological conditions.
- At the bottom of the Viewer interface a legend will now appear. The legend relates the meaning of the various colors in the 3D Visualization to the specific underlying values.
- Hover over the icon for the Overlay again, and notice that more options appear for Overlays related to the same calculation. These are the child overlays, which can display more specific types of results from the Waterwijzer calculation.
- Notice that other Overlays exist as well, to provide more insight:
- An Underground Overlay to show the underground Terrain Types. It has two child Overlays providing insight into the default values for groundwater: "NHI GLG" for the lowest groundwater levels, and "NHI GHG" for the highest groundwater levels.
- A "Subsidence Waterwijzer yield loss" Overlay, which performs the same calculation as the "Waterwijzer yield loss" Overlay, but includes the effects of a separate subsidence calculation. There is also a Subsidence Overlay which provides that input through its Child Overlays.
- At the top of the the viewer interface you can see the top bar. Click on any of the Indicators to open an indicator panel with information on how a score for the Project is determined.
- The "Lost yield" Indicator shows how many crops are damaged, causing potential yield to be lost. The greater the percentage of yield loss is, the lower the state of the project area scores. When the average amount of damage across the entire project area exceeds 50%, the score is 0. A few farmer's parcels are listed as well for a more detailed perspective on those parcels. The data underpinning this Indicator is taken directly from the "Waterwijzer yield loss" Overlay.
- The "Lost (subsidence)" Indicator performs the same calculation, but makes use of the "Subsidence Waterwijzer yield loss" Overlay instead. This means these results and scores take the effects of subsidence into account, and more actions can affect it.
- Finally, notice a number of icons floating in the 3D Visualization.
- The blue icons denote points-of-interest for the Waterwijzer Overlay which you can take a closer look at. You can click on any to open a panel with more information.
- The orange icon denotes a location where an action can be taken for the Subsidence Overlay, which in turn affects the "Subsidence Waterwijzer yield loss".
Points of interest
The project features a number of points of interest displaying specific features or phenomenons relevant to understanding what can affect the Waterwijzer Overlay's calculations.
Soil
Multiple types of underground terrain are present in this project area. Different subsoil types lead to different results due to the variance in water retention and subsurface flow potential.
In this demo project, the difference in soil type has been exaggerated to show more clearly how different soil types lead to different results.
Clicking on the popup will show the Underground Overlay, which shows what Terrain Types make up the underground.
When a project is first created, Terrains are automatically loaded in based on publicly available data. Each type of terrain features a BRP code as an Attribute, which is used as an input parameter for the Waterwijzer.
Groundwater
In locations with very low or very high groundwater levels, more damage is done to the plants above ground. Either due to a lack of water causing the plants to dry out, or an excessive amount of water, causing oxygen deprivation. In other words, the underground may be too wet or too dry.
However, as the underground terrain changes, the effects of the groundwater change as well. This is due in part because of measured groundwater levels differing geographically in correlation with the subsoil, but also because the flow of the water is the subsoil will differ, which in turn affects the plants.
Clicking on the popup will show the relevant yield loss Overlay, which shows the percentage of crops lost due to the hydrological circumstances.
Clicking on either popup will show the oxygen deprivation or drought result type Child Overlay, which shows the yield loss caused by that phenomenon specifically.
Crops
Different crops thrive under different circumstances. A soil type and a groundwater level which suits one type of crops will not be sufficient for another.
This area is mostly filled with grassland, but also includes a number of parcels with corn. Both types of crops prefer their own hydrological circumstances.
Accuracy
Although calculations can be performed with a high accuracy, in the end the results can only be as accurate as the provided data. Because this project uses the default NHI groundwater dataset, with an accuracy of 25m, the results of the calculation will show blocks of similar accuracy.
If you use this Overlay, and have more accurate groundwater data to load in, the results will become more accurate as well.
Subsidence
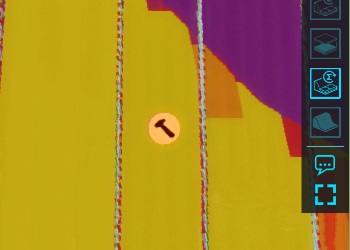
When the Overlay is linked to the Subsidence Overlay, actions affecting the rate of subsidence will also affect the groundwater levels, and thus the calculation of the yield loss.
Actions
After inspecting the results of the calculations based on the data present in the project, it is also possible to explore the effects of actions taken in the area. Note that when any of the actions described here are taken, a Test Run will start automatically.
This means the editing tools will be temporarily disabled. When you are done experimenting with actions, you can stop the test run by clicking the stop button in the ribbon. This will revert the session back to its base state, without the effects of the applied action(s).
Spatial actions
There are a number of spatial Actions which can affect the results of the calculation of the yield loss. It is possible to change the types of crops grown in the project area, or to place drainage in predefined locations to change the groundwater levels.
Switch to the "Future design" tab, and then in the Viewer interface the Action Menu will appear. This menu allows you make changes to the project.
Open the menu of "Parcel changes", and select the "Drainage with Onions" Measure. A selection will appear in the 3D Visualization where a predefined change will be made. Click on "Apply". This will perform the Measure. The eastern farmer's parcel's crops will be entirely replaced by a new crop type.
Open either of the Indicators by clicking on them in the top bar. Take note of the yield loss in the current situation, and in the planned situation. The difference is caused by the Action taken.
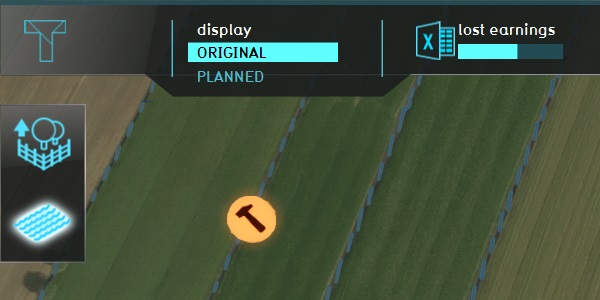
Open either of the yield loss Overlays too. Now in the Top bar, find the "display" option, and select the "Original" mode. This will display the results of the original calculation. Switch between the "Original" and "Planned" display modes to see how the results have changed.
Open the menu of "Free actions", and select the "Demolish" Action. You will be able to draw a selection in the 3D Visualization to remove existing crops. Make a selection by clicking on one or more parcels in the 3D Visualization, and then click on "Apply".
Next, in the "Free actions" menu, select the "Onions" Action. You will be able to draw a selection in the 3D Visualization to place new crop. Make a selection by click-and-dragging in the location cleared by the earlier demolition action. Then click on "Apply".
Open either of the Indicators by clicking on them in the top bar. Take note of the yield loss in the current situation, and in the planned situation. The difference is caused by the Action taken.
Indexation
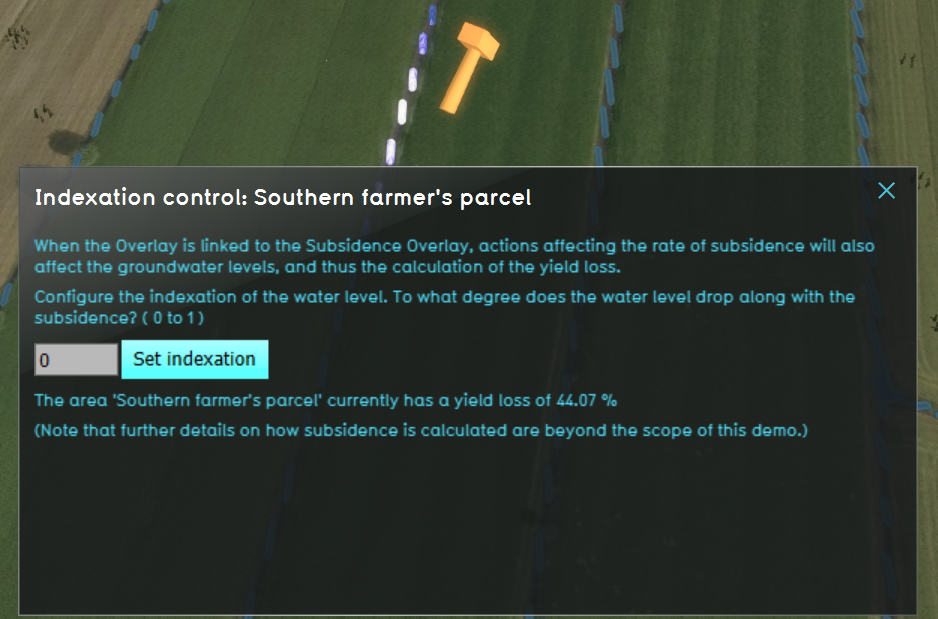
Find the orange popup in the 3D Visualization, and click it to open the related panel. It features a bit of information, and an input field where the "indexation" setting can be changed. Set it to "1", and submit the new setting by clicking the button. The Subsidence Overlay will recalculate, resulting in new groundwater levels. The "Subsidence Waterwijzer yield loss" Overlay will use those new groundwater levels to recalculate yield losses.
Switch to the "Future design" tab, and then in the Viewer interface the top bar will show the "display" option. By switching between the "Original" and "Planned" options, it's possible to compare the effect of changing the indexation on the yields.
How-to's
- How to add the Waterwijzer Overlay
- How to configure the Waterwijzer Overlay to use groundwater results from other calculations
See also


