Waterwijzer Module test results
Testing the Waterwijzer Module manually is feasible, as the performed calculations are not spatial. This means for any given location, only the parameters present in that particular location are used to perform a calculation.
By creating a Project with controlled parameters for the Waterwijzer Overlay, and comparing the results through a sample test, we have verified that the results presented in the Tygron Platform match the results of individual Waterwijzer queries exactly.
Testing principle
The best way to approach testing the connection is to set up a Project to produce a variety of results. Those results can then be manually read out, and the same configuration can be input in the online Waterwijzer tool[1]. Because the Tygron Platform connects to the same calculation model, the same input should also lead to the same output.
Setting up the project
- Create a new empty Project with a minimal size. By creating an empty project we have full control of the spatial data that is present.
Demarkation
Input for the Waterwijzer Module is determined through a number of visible and a number of invisible features. To make it easier to maintain an overview of what parameters are configured where, its recommended to add a number of visible features to the project to demark the extend of specific configurations.
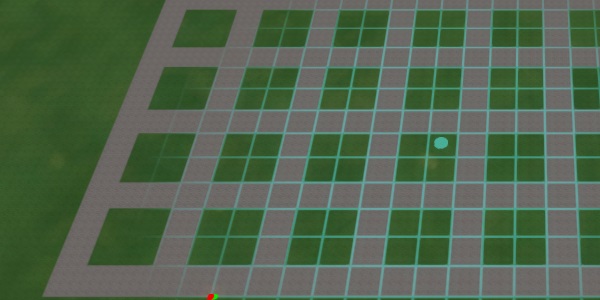
Using a distinctive Terrain Type such as "Concrete", draw a grid of plots. Make each plot approximately 20m by 20m. This should easily allow a grid of 10 by 10 plots.
Groundwater

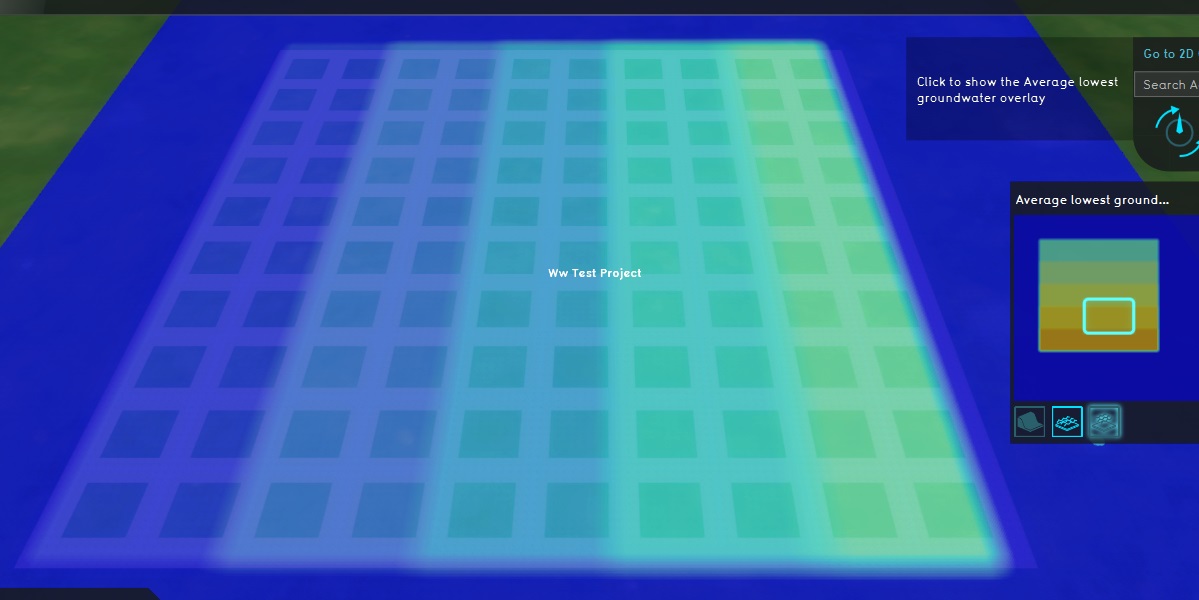
The groundwater situation is easiest to set up by using a Subsidence Overlay. It needn't calculate, but can have its groundwater situation directly configured through Areas and Attributes so that it's set to a specific value.
Across the "rows" of the grid currently drawn-in, the low groundwater result will vary. Across the "columns" of the grid, the high groundwater result will vary.
- Add a new Area and draw it's shape across all columns for the first 2 rows using the 3D Visualization. The Area will cover about 20 plots. Draw another Area across all columns for the next two rows, and repeat this until all plots are covered.
- Repeat this across all columns as well. The result should be a "checkerboard" of overlapping areas.
- Give all "row" Areas a LOW_GROUND_WATER_LEVEL Attribute. For the first row, set it to 0,5. For the second row, set it to 0,6. For the third row 0,7 , the fourth row 0,8 , and the fifth row 0,9.
- Give all "column" Areas a HI_GROUND_WATER_LEVEL Attribute. For the first row, set it to 0,1. For the second row, set it to 0,2. For the third row 0,3 , the fourth row 0,4 , and the fifth row 0,5.
- Add a Subsidence Overlay
- Configure the Subsidence Overlay to not use GeoTIFFs, defaulting it to determining groundwater levels through Area Attributes.
- Ensure the Subsidence Overlay outputs both a high groundwater result and a low groundwater result.
The 3D Visualization is now divided up into a 5 by 5 grid of similar blocks, each consisting of 4 plots 20m by 20m. The blocks differ in combination of low and high groundwater level.
Terrains

Terrains, specifically underground Terrain Types, all have a specific BOFEK_ID. Multiple can be added to the project to experiment with.
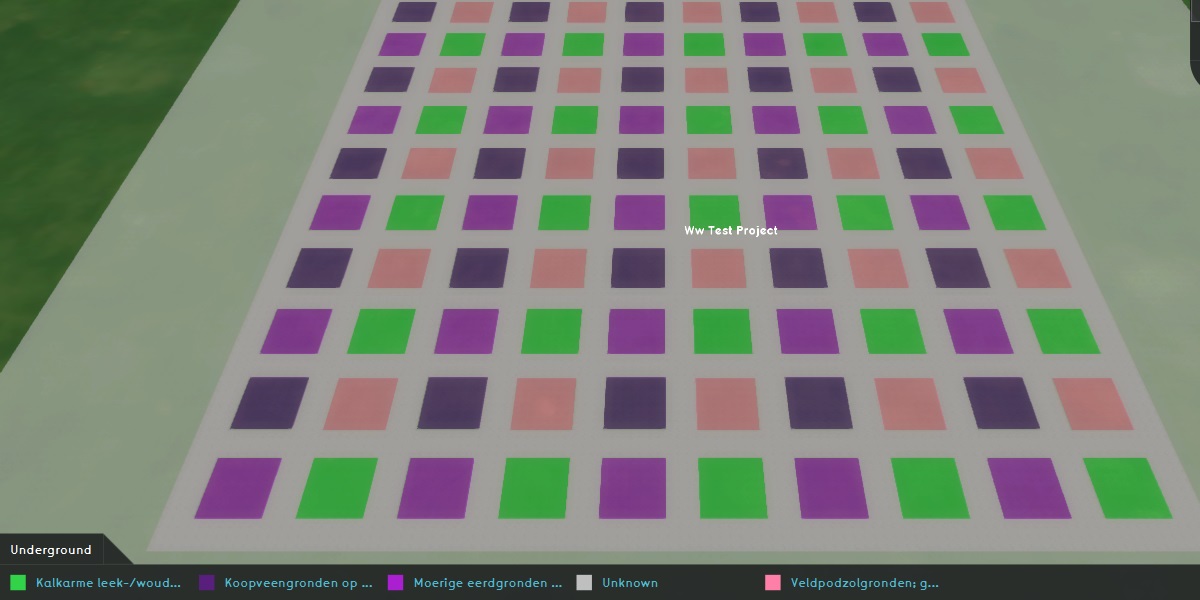
- For each block with plots with the same lowest groundwater and the same highest groundwater levels, draw the following Terrain Types in the following plots:
- In the north-west plot, draw the underground to be "Koopveengronden op bosveen (of eutroof broekveen)", which has BOFEK_ID 101.
- In the north-east plot, draw the underground to be "Veldpodzolgronden; grof zand", which has BOFEK_ID 320.
- In the south-west plot, draw the underground to be "Moerige eerdgronden met een moerige bovengrond op zand", which has BOFEK_ID 203.
- In the south-east plot, draw the underground to be "Kalkarme leek-/woudeerdgronden; klei, profielverloop 5", which has BOFEK_ID 415.
- Add an Underground Overlay, to review the configuration of the underground Terrain Types.
There is now a matrix of varying lowest groundwater levels, highest groundwater levels, and underground types.
Crops
Crops have a BRP Code as an Attribute assigned to them as part of the process of creating a new Project. New crops created through the Editor do not yet have a default code assigned to them, so regardless of the desired crops to test with, a code must be entered manually.
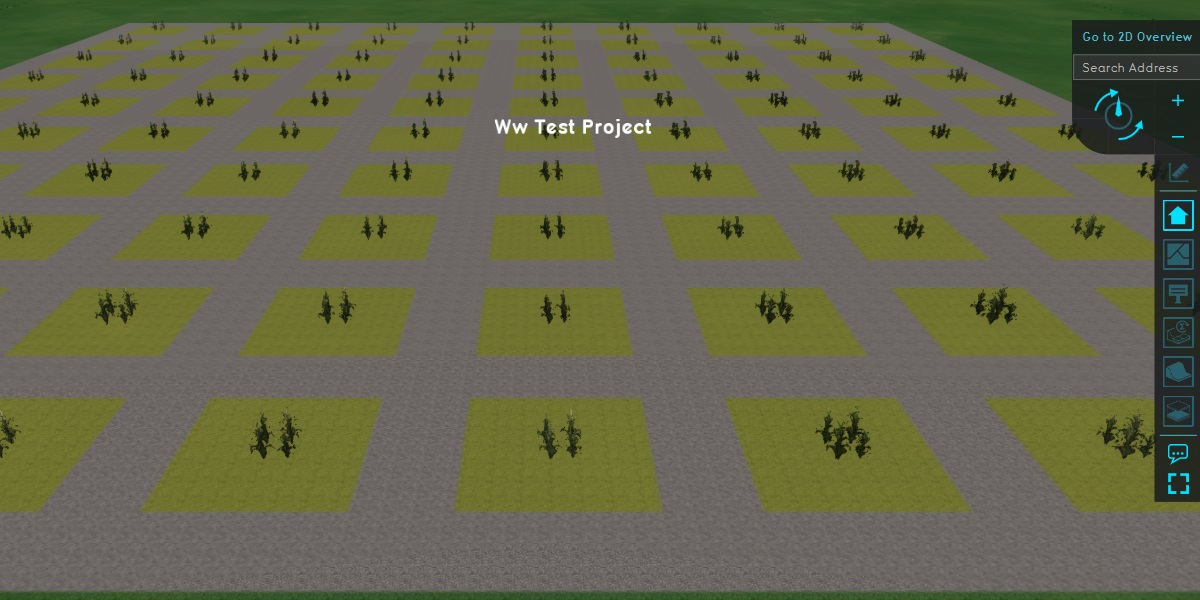
- Add a new Building to the Project.
- Add a BRP_CODE Attribute to the Building, with a value of "2014". This is the code matching "potatoes".
- Draw the Building in the project area using the 3D Visualization, so that it covers all the plots. Note that this doesn't need to be exact; it's just important that all plots are covered.
- Set the Function of the Building to an agrarian type. Note that this is for visuals only, as only its BRP Code Attribute is used for the Waterwijzer Overlay.
Overlay
Finally, the actual Waterwijzer Overlay has to be added and configured to perform the calculations.
- Add the Waterwijzer Overlay to the Project.
- Configure it to use the Subsidence Overlay's low groundwater result type for its low groundwater levels.
- Configure it to use the Subsidence Overlay's high groundwater result type for its high groundwater levels.
- Activate all result types of the Waterwijzer Overlay.
Results
The world now contains a checkerboard of varying results. These results can be easily checked against the online Waterwijzer tool[1]. A sample test is sufficient to validate that the results displayed/used in the Tygron Platform match the results of the online tool.
Obtaining results
Individual results can be obtained as follows.
Reading a result from the Tygron Platform
- Choose any of the plots to inspect
- Open the Subsidence Overlay's ground water result types, and note the groundwater levels in the selected plot.
- Open the Underground Overlay, and click on Terrains in theribbon bar. Click on the selected plot, and the relevant Terrain Type will be selected. Note the Terrain Type's BOFEK_ID.
- Open the Waterwijzer Overlay, and click on on the plot. Note the result listed in the hover panel.
- Open the Waterwijzer Overlay's child overlays, and click on the plot. Note the result listed in the hover panel for each one.
Reading a result from the online Waterwijzer tool
- Open the online Waterwijzer tool[1].
- As crops, select "Aardappelen" (which are potatoes, matching the crop's BRP_CODE of the Project.
- Leave the climate ("klimaat") and weather station ("Weerstation") as-is.
- For the underground ("bodem"), select the type matching the Terrain Type found in the plot selected in the Tygron Platform.
- For the groundwater ("grondwater"), set the "GHG" to the high groundwater level found in the selected plot, and the "GLG" to the low groundwater level found in the selected plot.
- Note the displayed yield losses, both the total as well as the individual components.
The results obtained in the Tygron Platform should be identical to the results obtained from the online Waterwijzer tool.
Sampled results, compared
Using the Project constructed in accordance with the preceding instructions, and the preceding instructions for retrieving comparable results, the following sampled set has been established. All inspected results match exactly.
| GHG | GLG | BOFEK ID | BRP Code | Tygron result | Waterwijzer tool result |
|---|---|---|---|---|---|
| 0,1 | 0,5 | 101 | 2014 |
|
|
| 0,2 | 0,6 | 320 | 2014 |
|
|
| 0,3 | 0,7 | 203 | 2014 |
|
|
| 0,4 | 0,8 | 415 | 2014 |
|
|
| 0,5 | 0,9 | 101 | 2014 |
|
|
| 0,5 | 0,5 | 320 | 2014 |
|
|
| 0,1 | 0,9 | 203 | 2014 |
|
|
| 0,2 | 0,8 | 415 | 2014 |
|
|
| 0,5 | 0,7 | 203 | 2014 |
|
|
| 0,3 | 0,6 | 320 | 2014 |
|
|
Configurations
To test more and different configurations, it's possible to change the parameters as desired. Most notably, it's possible to change the crop type by editing the crops' BRP_CODE Attribute.
References
- ↑ 1.0 1.1 1.2 Waterwijzer Landbouw online tool, https://waterwijzerlandbouw.wur.nl/tool.html, last visited on 31-8-2020

