Demo Heat Stress Project
| Next page>> |

The Demo Heat Stress project is available for all users and can be found in the main menu under Edit projects. This project does not count towards your license.
This project is intended for people who are working in fields such as climate adaptation, environmental studies, data analysis and visualization and urban planning.
This project showcases the DPRA Heat Module calculating PE Temperature in a benchmark project area.
The demo is a working project in which the DPRA Heat Stress Module is used to visualize and analyze the heat stress in the Wageningen area. This project area is chosen because this area is used for the Dutch benchmark for the Heat Stress model described in the DPRA Heat stress report. This demo project is based on that benchmark project, with a few minor changes.
This project is based on the completed version of the Heat Stress Overlay tutorial. To learn how the project was created, please follow the Heat Stress Overlay tutorial.
About the project
The project shows the Wageningen area which is a combination of an urban environment and a rural area. In this demo project, the heat stress at several moments on a specific day are visualized: between noon and 6 p.m. on August 2nd, 2013. This date has been chosen for this project because it has been used by the DPRA benchmark. In the Tygron Platform it is possible to select your own date(s) and time over which you want to analyze the heat stress. In the Heat Stress Overlay tutorial you can learn how to change these settings.
Infrared estimation for foliage
Foliage height is an important factor in the Heat DPRA calculation model. It can be based on:
- trees (buildings with tree functions), where the foliage height is calculated based on the trees height and foliage crown factor;
- foliage areas: areas that can be imported, each with the attribute that represents a foliage height.
- a foliage grid. This grid can be based on a GeoTIFF, or can be the result of a combination of multiple combo, average and other overlays.
If individual trees are poorly recorded and known foliage heights cannot be obtained via Areas or GeoTIFFs, we provide an alternative method for determining foliage. This approach estimates vegetation presence using infrared satellite imagery and heightmap readings to locate vegetation above the surface.
- A WMS Overlay is used to obtain the infrared satellite imagery
- A WCS Overlay is used to obtain an unmodified version of the AHN height dataset
- Combo Overlays are used to:
- Determine the presence of vegetation based on infrared data
- Determine deviations in height based on different heightmap interpretations
- Check whether both of those factors are true
- The Heat Stress Overlay then uses the result as a foliage prequel
Explore the current situation
- Click anywhere in the 3D Visualization, and use the arrow keys on your keyboard to move the Camera around. You can also move the camera with the mouse; See Camera#Standard.
- Zoom out and observe the current situation. By default you start in the default map. On the right side of the project area you see the bar with overlays. Click on a few overlays to see the information you can get about the current situation.
- Open the PE Temperature overlay by clicking the Heat Stress icon. A minimap and several child overlay icons will appear, along with a play button above the legend in the viewer interface.
- The already-selected PE Temperature overlay shows heat stress levels between 12 p.m. and 6 p.m. on August 2nd, 2013. Click the play button to view hourly changes in heat stress.
- Select the Foliage child overlay and click play. Because foliage represents tree height, which remains constant over six hours, the results will not change over time.
- Repeat this for all child overlays: Sky view factor, Shade, Wind speed, Bowen ratio and Urban heat island. Select and play them and take note of what you see.
- Finally, open the green indicator in the top bar to view project targets. For example, 'Oude Stad Binnenstad' currently has 72 m² of green per house against a target of 300 m², requiring an additional 228 m².
-
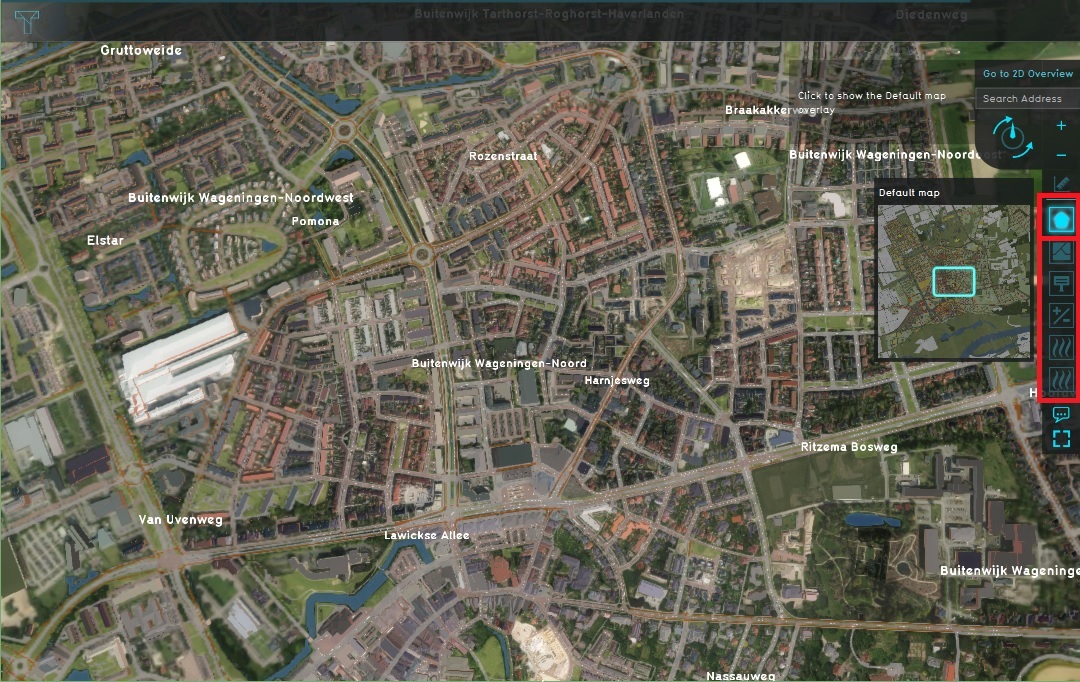 2. Select several overlays
 -
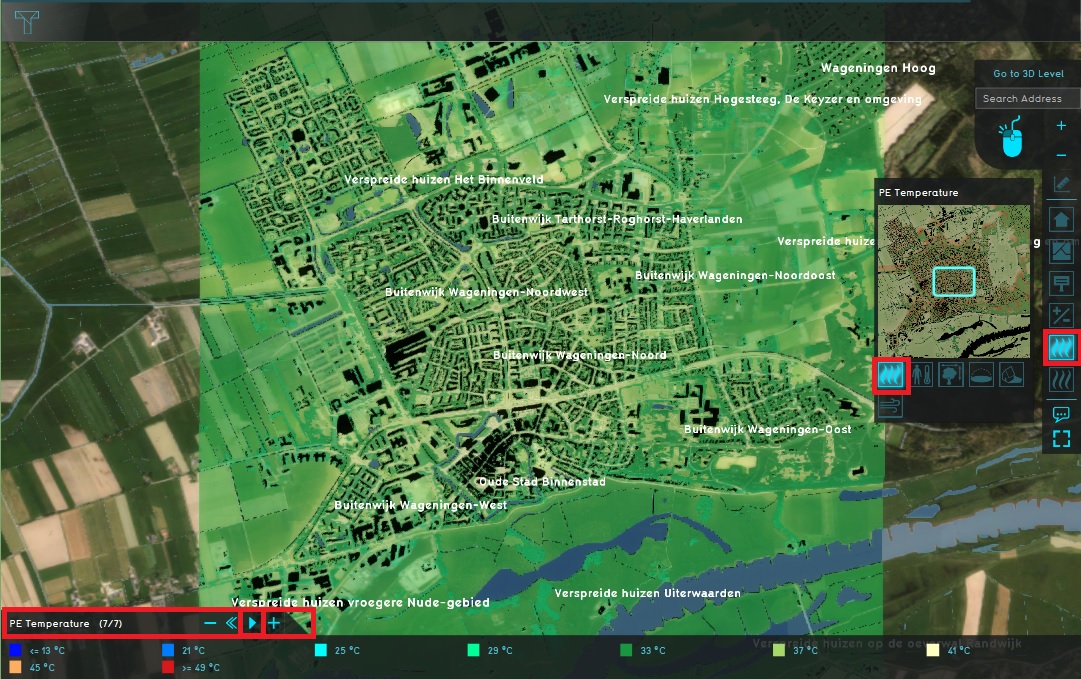 3. Select the PE Temperature overlay
 -
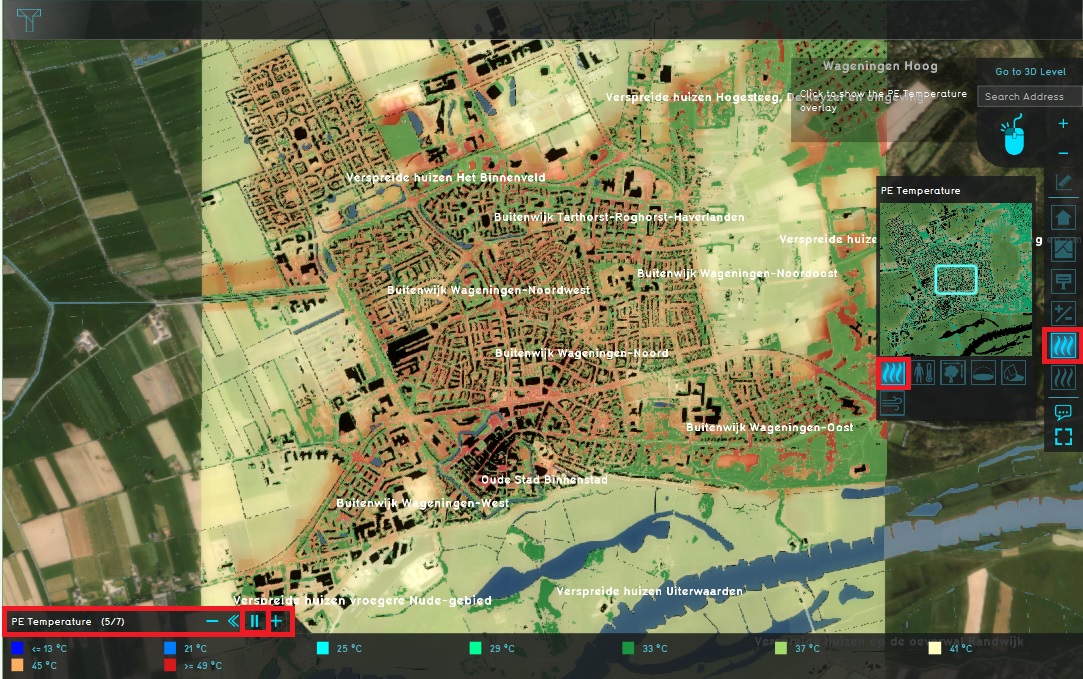 4. Notice the results over time
 -
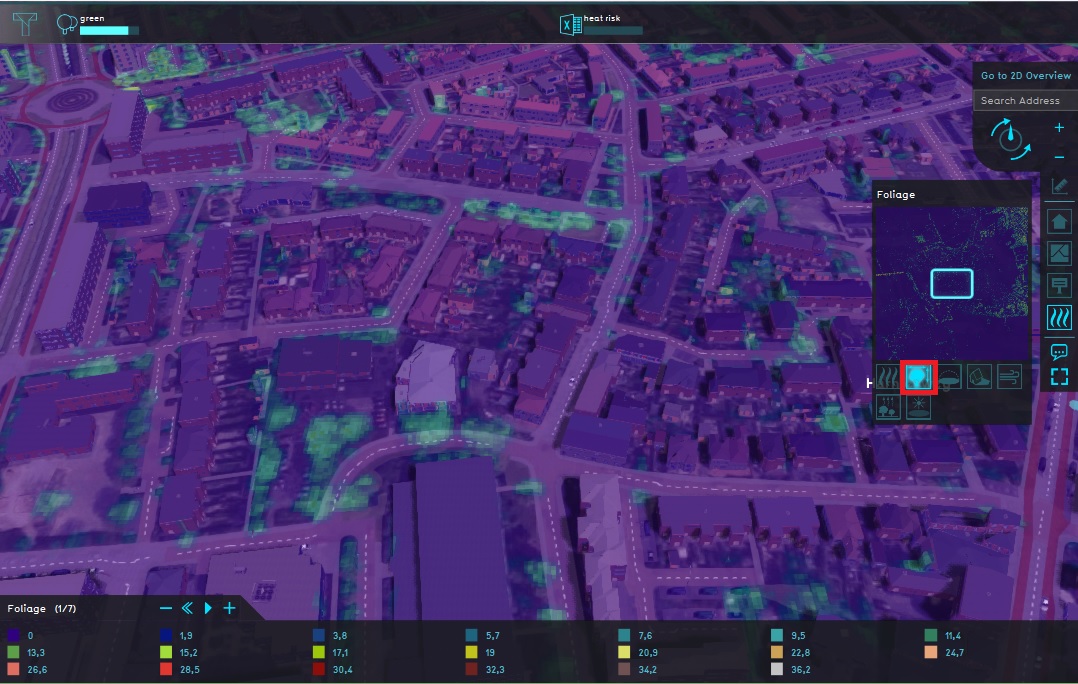 5. Select the Foliage overlay and activate the time frames
 -
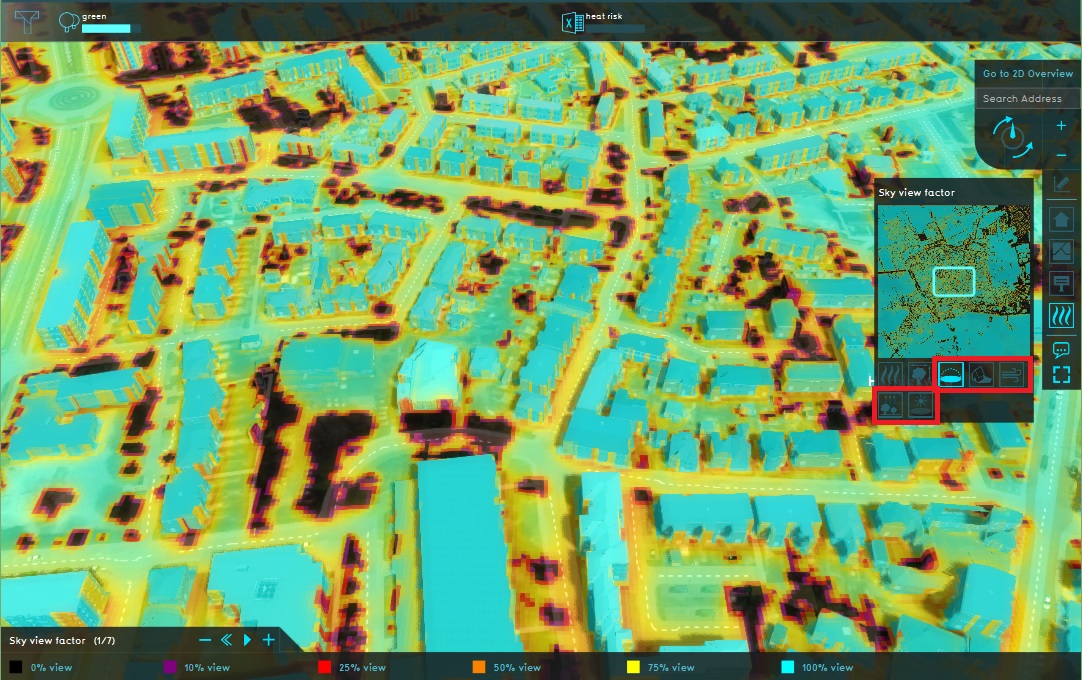 6. Other child overlays
 -
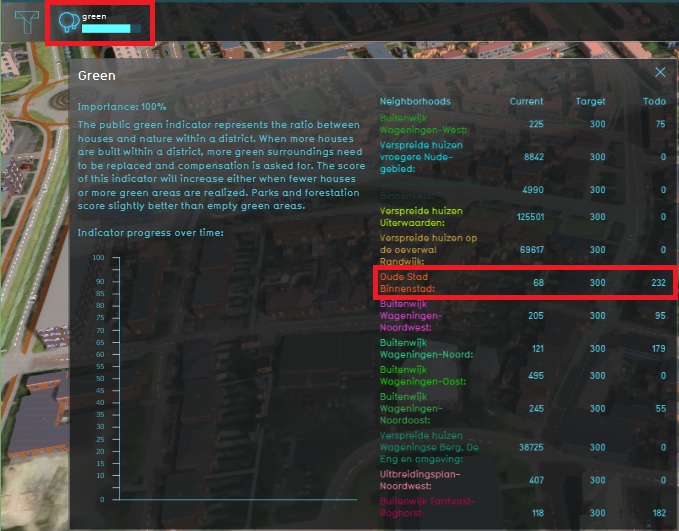 7. Open green indicator and notice target


See also
| Next page>> |