How to show Overlays in Power BI: Difference between revisions
Jump to navigation
Jump to search
No edit summary |
No edit summary |
||
| (2 intermediate revisions by the same user not shown) | |||
| Line 30: | Line 30: | ||
|Icon_Map_visual.JPG|Icon Map visual button. | |Icon_Map_visual.JPG|Icon Map visual button. | ||
|Icon_Map_config_long_lat.JPG|Icon Map configuration for Neighborhoods visualized as center points. | |Icon_Map_config_long_lat.JPG|Icon Map configuration for Neighborhoods visualized as center points. | ||
|Icon_Map_long_lat.JPG|Icon Map with Neighborhoods visualized as center points. | |||
|Show_WMS.JPG|Location in the Editor of the WMS Endpoint. | |Show_WMS.JPG|Location in the Editor of the WMS Endpoint. | ||
|Icon_Map_Format_Visual_WMS_timeframe.JPG|Icon Map Format Visual WMS Section with Overlay timeframe layer. | |Icon_Map_Format_Visual_WMS_timeframe.JPG|Icon Map Format Visual WMS Section with Overlay timeframe layer. | ||
|Icon_Map_WMS_timeframe.JPG|Icon Map [[Heat stress Overlay]] timeframe 2. | |Icon_Map_WMS_timeframe.JPG|Icon Map [[Heat stress Overlay]] timeframe 2. | ||
|Icon_Map_Format_Visual_WMS_satellite.JPG|Icon Map Format Visual WMS Section with Satellite layer. | |Icon_Map_Format_Visual_WMS_satellite.JPG|Icon Map Format Visual WMS Section with Satellite layer. | ||
|Icon_Map_WMS_satellite.JPG|Icon Map Satellite | |Icon_Map_WMS_satellite.JPG|Icon Map Satellite Layer. | ||
}} | }} | ||
| Line 42: | Line 43: | ||
|howtos= | |howtos= | ||
* [[How to access your project data in Power BI]] | * [[How to access your project data in Power BI]] | ||
* [[How to show Indicator results in Power BI]] | |||
* [[How to show polygon data in Power BI]] | |||
|seealso= | |seealso= | ||
* [[Power BI]] | * [[Power BI]] | ||
| Line 49: | Line 52: | ||
* To access a different [[timeframe]] for an Overlay, type the Overlay ID followed by a dash and then the timeframe number. For example: 14-3, 10-0 or 3-99. | * To access a different [[timeframe]] for an Overlay, type the Overlay ID followed by a dash and then the timeframe number. For example: 14-3, 10-0 or 3-99. | ||
}} | }} | ||
[[Category:How-to's]] | |||
Latest revision as of 16:15, 30 January 2024
How to show Overlays in Power BI:
- Open or create a Power BI project that has a web connection to Neighborhoods of a project session. See this How-to;
- Select the visuals tab in your Power BI Project
- Click on the triple dots icon named "Get More Visuals" and select the option "Get More Visuals".
- In the search field, type "Icon" and select the "Icon Maps" app.
- On the Icon Map app page, click on the "Add" button.
- Unfold the "Neighborhoods" data connection
- Find and drag the features.properties.LONGITUDE and LATITUDE attributes to the corresponding Longitude and Latitude fields in the visual tab
- Find and drag the features.properties.NAME attribute to the Category field.
- Select a numerical property, such as feature.properties.ACTIVE and drag it to the Size field.
- The Icon Map should now show the neighborhoods center locations.
- Select the Format your visual tab and unfold the WMS Layer section.
- Click on the Off button to activate it.
- Switch to the Tygron Client Application to obtain the WMS Endpoint Url.
- Select Tools in the Ribbon bar
- Hover over API Overview and select Show WMS Endpoint. A Web browser opens.
- Copy the url stated in the OnlineResource element of the Service element.
- Switch back to the WMS Layer section of the icon map in Power BI.
- Paste the URL in the WMS URL field.
- Select the layer field and type 1. (This is the ID number for the Neighborhoods overlay)
- The Neighborhoods Overlay should now be visualized in the Icon Map.
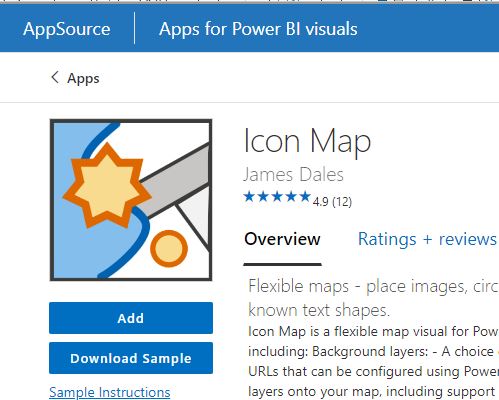
Icon Map app page in Power BI app store.
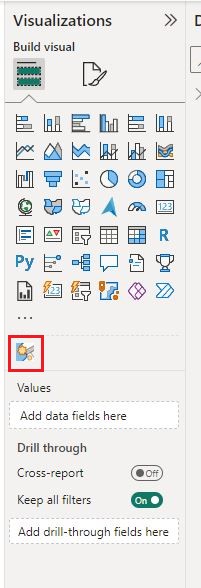
Icon Map visual button.
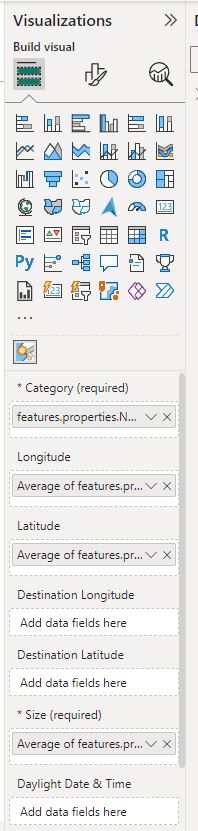
Icon Map configuration for Neighborhoods visualized as center points.
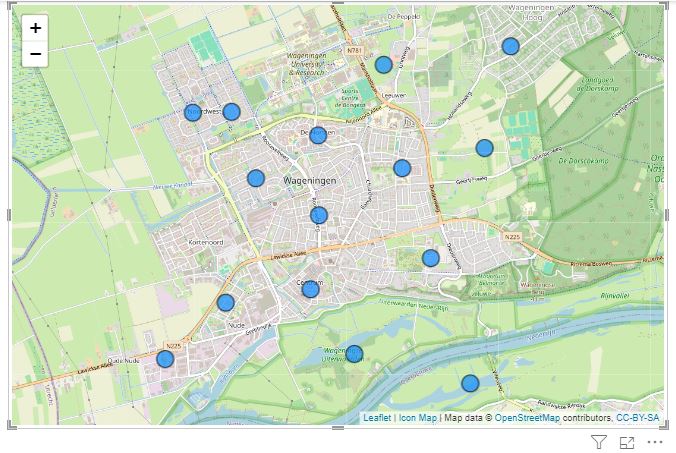
Icon Map with Neighborhoods visualized as center points.
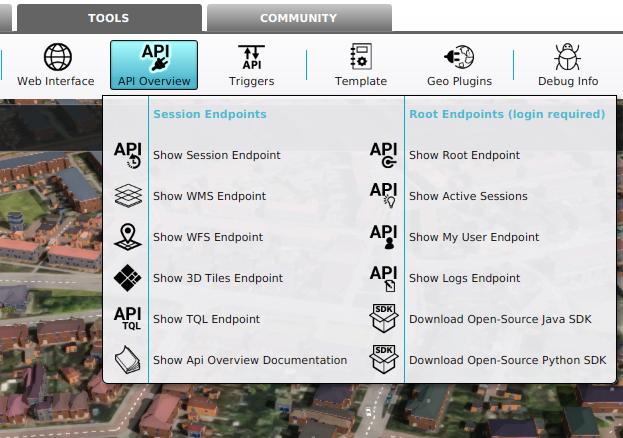
Location in the Editor of the WMS Endpoint.
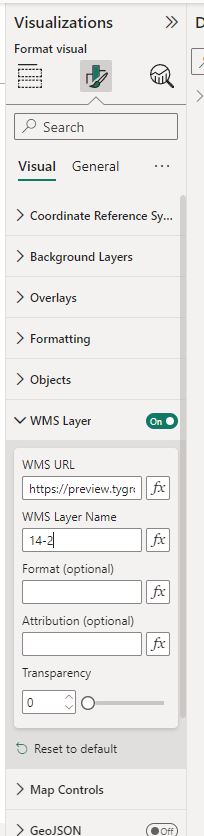
Icon Map Format Visual WMS Section with Overlay timeframe layer.
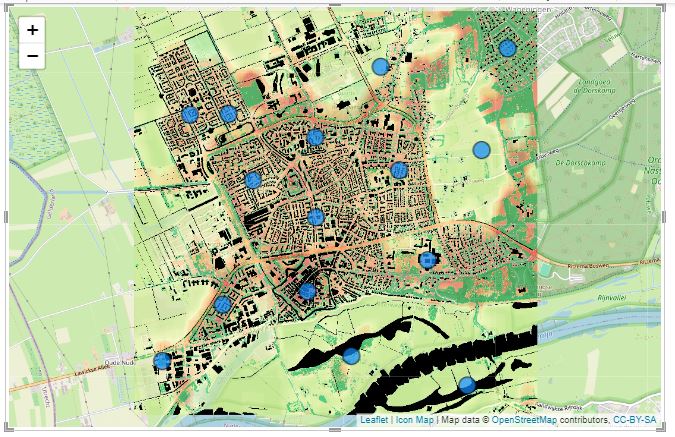
Icon Map Heat stress Overlay timeframe 2.
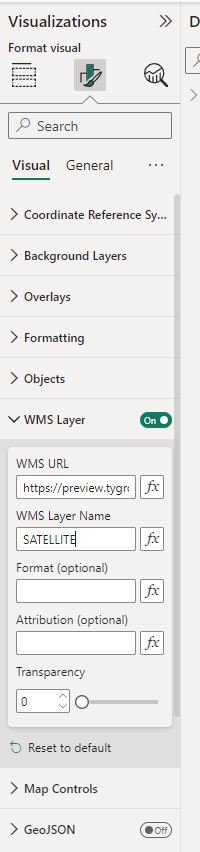
Icon Map Format Visual WMS Section with Satellite layer.
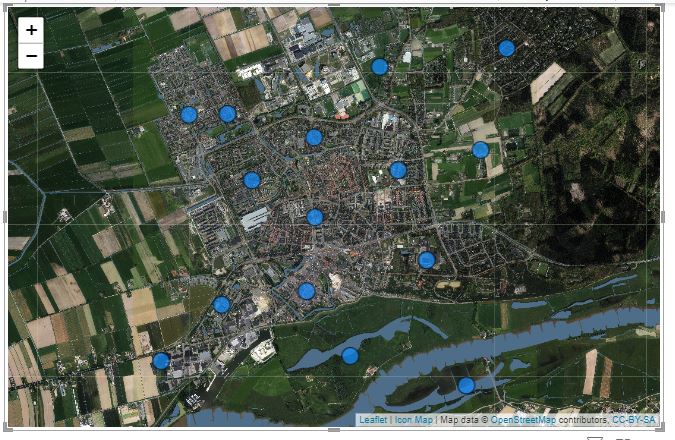
Icon Map Satellite Layer.


Notes
- Instead of an Overlay ID number, you can also use the WMS background layers.
- To access a different timeframe for an Overlay, type the Overlay ID followed by a dash and then the timeframe number. For example: 14-3, 10-0 or 3-99.
How-to's
- How to access your project data in Power BI
- How to show Indicator results in Power BI
- How to show polygon data in Power BI