How to make a Grid Overlay of residences
Jump to navigation
Jump to search
For some use-cases, it may be useful to have a Grid Overlay of locations of residences. Residences may sometimes be treated with additional care or consideration, or may have additional restrictions or protections applied to them. As such, having a dynamically calculated overview of their locations can be very relevant. Such a Grid Overlay can be created by testing which locations have a defined size for residences.
How to create a Grid Overlay of residences:
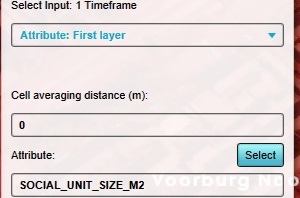
- Add an Average Overlay, configured so that:
Name: Social residences
Attribute to average is SOCIAL_UNIT_SIZE_M2
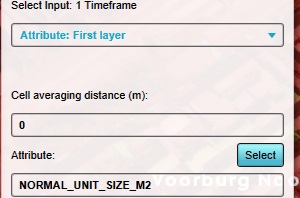
Averaging distance is 0 - Add an Average Overlay, configured so that:
Name: Market residences
Attribute to average is NORMAL_UNIT_SIZE_M2
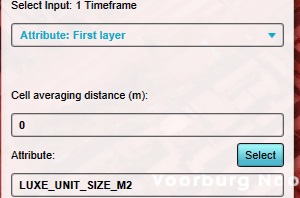
Averaging distance is 0 - Add an Average Overlay, configured so that:
Name: Luxury residences
Attribute to average is LUXE_UNIT_SIZE_M2
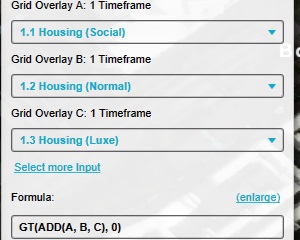
Averaging distance is 0 - Add an Combo Overlay, configured so that:
Name: Residences
A: "Social residences" Overlay
B: "Market residences" Overlay
C: "Luxury residences" Overlay
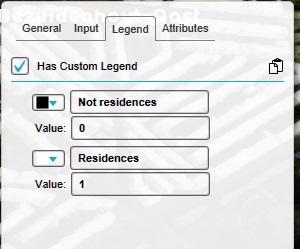
Formula: GT(ADD(A,B,C),0) - Switch to the "Legend" tab, and activate the "custom legend".
- Remove all pre-existing entries.
- Add an entry, configured so that:
Name: Not residences
value: 0
Color: black - Add an entry, configured so that:
Name: Residences
value: 1
Color: lightgray
- Add an Average Overlay, configured so that:
Notes
- Although there are also "senior housing" and "student housing" categories of residences available, those are rarely used and as such not includes in the instructions. To add them, add 2 more Average Overlays with SENIOR_UNIT_SIZE_M2 and STUDENT_UNIT_SIZE_M2 respectively, add then to inputs D and E of the Combo Overlay, and expand the formula to include the D and E parameters: GT(ADD(A,B,C,D,E),0)
