Waterwijzer Module test results
Testing the Waterwijzer Module manually is feasible, as the performed calculations are not spatial. This means for any given location, only the parameters present in that particular location are used to perform a calculation.
Setting up the project
- Create a new empty Project with a minimal size. By creating an empty project the state of the 3D world is entirely known.
- Add the Waterwijzer Overlay to the Project. This will perform the actual calculations.
Demarkation
Input for the Waterwijzer Module is determined through a number of visible and a number of invisible features. To make it easier to maintain an overview of what parameters are configured where, its recommended to add a number of visible features to the 3D world to demark the extend of specific configurations.
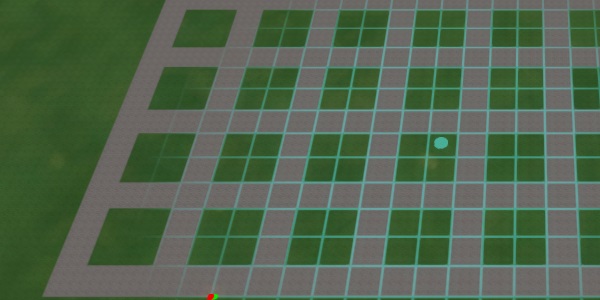
Using a distinctive Terrain Type such as "Concrete", draw a grid of plots. Make each plot approximately 20m by 20m. This should easily allow a grid of 10 by 10 plots.
Groundwater
The groundwater situation is easiest to set up by using a Subsidence Overlay. It needn't calculate, but can have its groundwater situation directly configured through Areas and Attributes so that it's set to a specific value.
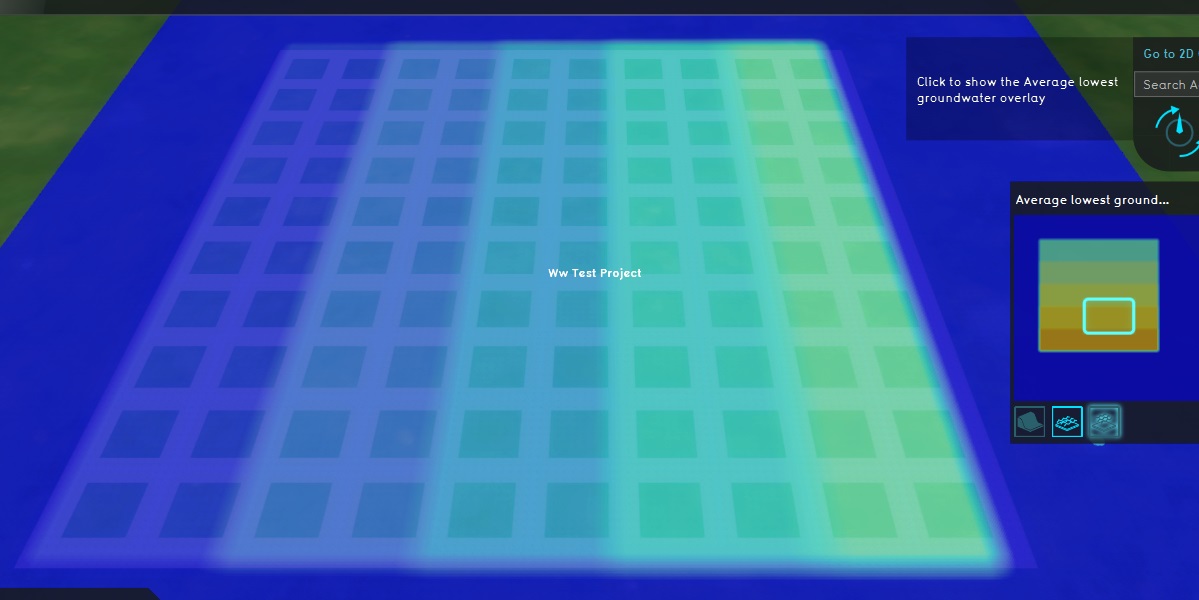
Across the "rows" of the grid currently drawn-in, the low groundwater result will vary. Across the "columns" of the grid, the high groundwater result will vary.
- In the 3D world, create and draw an Area across all columns for the first 2 rows. The Area will cover about 20 plots. Draw another Area across all columns for the next two rows, and repeat this until all plots are covered.
- Repeat this across all columns as well. The result should be a "checkerboard" of overlapping areas.
- Give all "row" Areas a GLG Attribute. For the first row, set it to 0,5. For the second row, set it to 0,6. For the third row 0,7 , the fourth row 0,8 , and the fifth row 0,9.
- Give all "column" Areas a GHG Attribute. For the first row, set it to 0,1. For the second row, set it to 0,2. For the third row 0,3 , the fourth row 0,4 , and the fifth row 0,5.
- Add a Subsidence Overlay
- Configure the Subsidence Overlay to not use GeoTiffs, defaulting it to determining groundwater levels through Area Attributes.
- Ensure the Subsidence Overlay outputs both a high groundwater result and a low groundwater result.
The 3D world is now divided up into a 5 by 5 grid of similar blocks, each consisting of 4 plots 20m by 20m. The blocks differ in combination of low and high groundwater level.


