UK EA benchmark 2 (Water Module)

This benchmark performs test case 2 of the UK EA benchmark named Test 2 – Filling of Floodplain Depressions, using the Tygron Platform.
The test has been designed to evaluate the capability of a package to determine inundation extent and final flood depth, in a case involving low momentum flow over a complex topography.[1]
A copy of this test project is made available to everyone, providing hands-on insights to those interested. The project can be found on the LTS server under the name UKEA benchmark 2. This is covered in more detail in this section.
Description

The area modelled, shown in Fig. (a), is a perfect 2,000 m x 2,000 m square and consists of a 4 x 4 matrix of ~0.5-m deep depressions with smooth topographic transitions. The DEM (digital elevation model) was obtained by multiplying sinusoids in the north to south and west to east directions, and the resulting depressions are all identical in shape. An underlying average slope of 1:1,500 exists in the north to south direction, and of 1:3,000 in the west to east direction, with a ~2-m drop in elevation along the north-west to south-east diagonal.[1]
The inflow boundary condition was applied along a 100-m line running south from the northwestern corner of the modelled domain, indicated by a red line in Fig. (a). A flooding with a peak flow of 20 m3/s and time base of ~85 minutes was implemented according to the hydrograph in Fig. (b). The model was run for 2 days (48 hours) to allow the inundation to settle to its final state.[1]

Initial and boundary conditions
- Initial condition: dry bed
- Inflow along the red line in Fig. (a)
- All other boundaries are closed
Parameter values
- Manning’s n: 0.03 (uniform)
- Model grid resolution (m): 20 m (or ~10,000 nodes in the area modelled)
- Simulated time (h): 48
Technical setup
The required DEM is provided as an ASCII file (test2DEM.asc). As its cell size is 2 m, whereas the test is expected to be run on a 20-m grid, it will be automatically rescaled by the Rasterization process. The dimensions of the test area must be 2,000 by 2,000 m. The original DEM had an offset of -200 m, which was cropped down to -20 m (= 1 grid cell) so it could function as border cell. The rescaled and cropped ASCII file is provided in the .zip archive at the bottom of this page.

Original 2-m heightmap (2,400 m x 2,400 m) 
Cropped and rescaled to 20-m grid (2,040 m x 2,040 m). The black perimeter designates the border cells. 
Inlet series in the upper left corner.


In order to regulate the water level according to the water-level graph, the following setup was used: Inlet objects were placed on single grid cells with a constant value for x = 1 and y varying from 1 to 5, yielding a total of 5 points. The inlets were configured as follows:
- External area (m2): 1,000,000,000 (default)
- Water level (m): 1 (default)
- Threshold (m): none (default)
- Inlet Q (m3/s) : 20 in total, thus 4 per inlet

Output as required
Stats
- Software package used: Tygron Platform
- Numerical scheme: FV (Kurganov, Bollerman, Horvath)
- Total object flow (m3): 96,985.64
- Remaining volume water (m3): 96,982.30
Test results
Point graph measurements from the Tygron Platform (left) and other packages (right):


Last frame
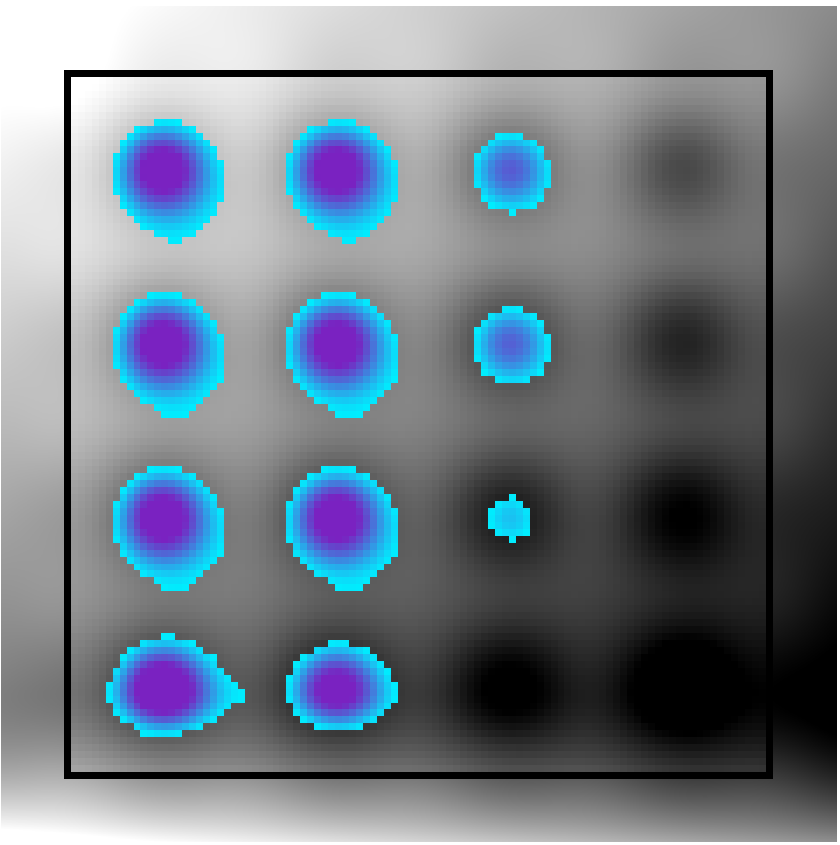
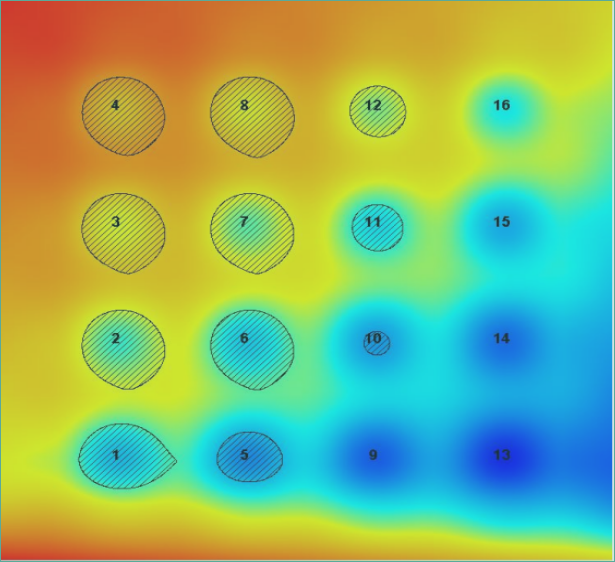
- Final timeframe of water levels as generated by the Tygron Platform (left) and by the other packages (right).


Notes
- Tests used a multi-GPU setup, though single GPUs are faster for small cases. Requesting 576 timeframes reduces performance; one GPU with one timeframe takes 8s, roughly 53% faster than two GPUs with 576 timeframes.
Public test project
A copy of this test project is made available to everyone, providing hands-on insights to those interested. The project can be found on the LTS server under the name UKEA benchmark 2. This project reproduces the benchmark test using a map size of 2,040 m x 2,040 m to accommodate 20-m border cells. These special map dimensions are generally not selectable in the New Project Wizard and require configuration through the API, specifically using the project creation or update endpoints.
Measurement points
The locations of the measurement points are:
| Point ID | X | Y |
|---|---|---|
| 1 | 275 | -1,780 |
| 2 | 275 | -1,290 |
| 3 | 275 | -790 |
| 4 | 275 | -290 |
| 5 | 775 | -1,780 |
| 6 | 775 | -1,290 |
| 7 | 775 | -790 |
| 8 | 775 | -290 |
| Point ID | X | Y |
|---|---|---|
| 9 | 1,275 | -1,780 |
| 10 | 1,275 | -1,290 |
| 11 | 1,275 | -790 |
| 12 | 1,275 | -290 |
| 13 | 1,775 | -1,780 |
| 14 | 1,775 | -1,290 |
| 15 | 1,775 | -790 |
| 16 | 1,775 | -290 |
The coordinate system differs from the benchmark testing in Fig. (b). The center (0,0) is at the top-left rather than the bottom-left; therefore, the bottom-right corner is (2,000;-2,000).
Water level relative to datum
The time series of a fixed measurement point can be obtained as follows:
- Go to the flooding overlay "Water Level (m)".
- Select the measuring tool.
- From the Saved dropdown choose your point of interest.
- From the Base dropdown select "Surface Elevation (m)".
- Make sure the Sum box is checked.
- Select Fit Graph to zoom in on the relevant part of the plot.
Settings & output
| Setting | Unit | Value |
|---|---|---|
| GRAVITY | m/s2 | 9.80665 |
| QUAD_CELL | Boolean | 0 |
| WALL_ANGLE | ° | 89 |
| Open land | m2 | 14,786,560 |
| Manning's n | s/(m1/3) | 0.03 |
| Calc. pref. | Accuracy |
| Output | Unit | Value |
|---|---|---|
| Total volume | m3 | 97,194 |
| Single cells | 10,404 | |
| Calc. steps | 250,709 | |
| Calc. time | s | 25 |
Notes
- Output values may deviate from initial testing due to software engine updates occurring between project setups.
References
- ↑ 1.0 1.1 1.2 Benchmarking the latest generation of 2D hydraulic modelling packages. Report: SC120002 ∙ Néelz, S., & Pender, G. (2013) ∙ Environment Agency, Horison House, Deanery Road, Bristol, BS1 9AH. ISBN: 978-1-84911-306-9 ∙ Found at: https://www.gov.uk/government/publications/benchmarking-the-latest-generation-of-2d-hydraulic-flood-modelling-packages