Tygron for GIS Data: Difference between revisions
No edit summary |
|||
| Line 50: | Line 50: | ||
6 credits | 6 credits | ||
===Guidance and | ===Guidance and resources=== | ||
1 week to find out what the student wants to research and to get the license from the university | 1 week to find out what the student wants to research and to get the license from the university | ||
1 day to get to know Tygron, but it took 1 week to know what to do with it (exporting results, recording, etc.) | 1 day to get to know Tygron, but it took 1 week to know what to do with it (exporting results, recording, etc.) | ||
| Line 68: | Line 68: | ||
Research question: What is the most effective way to place trees to reduce the PET during a heat wave in Utrecht? | Research question: What is the most effective way to place trees to reduce the PET during a heat wave in Utrecht? | ||
What is the effect of trees planted in rows along roads, on the reduction of the PET during a heat wave, in Utrecht? | *What is the effect of trees planted in rows along roads, on the reduction of the PET during a heat wave, in Utrecht? | ||
What is the effect of trees planted in groups, on the reduction of the PET during a heat wave, in Utrecht? | *What is the effect of trees planted in groups, on the reduction of the PET during a heat wave, in Utrecht? | ||
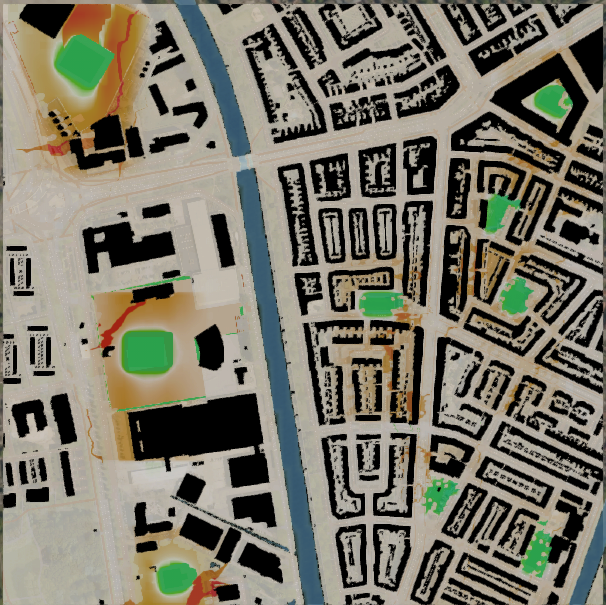
<gallery caption="Tygron Model showing the heat stress in the Rivierenwijk at 14:00 using the DPRA Heat Module" mode="packed-overlay" heights=250px> | |||
File:normal scenario 2pm.png | Current situation | |||
File:lanes 2 pm.png | Situation with trees placed in lanes | |||
File:groups 2 pm.png |Situation with trees placed in groups | |||
</gallery> | |||
[[File:Report_GIS_BSc_Research_Project_Max_Brink.pdf]] | [[File:Report_GIS_BSc_Research_Project_Max_Brink.pdf]] | ||
[https://storymaps.arcgis.com/stories/c2deb353a47b46d4a337ed15bb454728 StoryMap] | [https://storymaps.arcgis.com/stories/c2deb353a47b46d4a337ed15bb454728 StoryMap] | ||
<gallery caption="Maps showing the PET (Physiological Equivalent Temperature) heat stress in the Rivierenwijk at 17:00" mode="packed-overlay" heights=300px> | |||
File:lanes 5 pm.png | Situation with trees placed in lanes | |||
File:groups 5 pm.png | Situation with trees placed in groups | |||
</gallery> | |||
==Feedback and recommendations== | ==Feedback and recommendations== | ||
<pre style="white-space: pre-wrap; | |||
white-space: -moz-pre-wrap; | |||
white-space: -pre-wrap; | |||
white-space: -o-pre-wrap; | |||
word-wrap: break-word;"> | |||
The Tygron Geodesign Platform is nowadays mainly used by municipalities, water boards and provinces for discussions about certain land use decisions. However, as this project has shown, the options for using the validated overlays, such as the Heat Overlay, make the platform also suitable for research projects. | The Tygron Geodesign Platform is nowadays mainly used by municipalities, water boards and provinces for discussions about certain land use decisions. However, as this project has shown, the options for using the validated overlays, such as the Heat Overlay, make the platform also suitable for research projects. | ||
Max Brink, WUR | |||
</pre> | |||
==Contact== | ==Contact== | ||
Max Brink max.brink@wur.nl | For more information about this course, you can contact us at: info@Tygron.com | ||
You can also reach Max Brink, the student who used Tygron in this course: max.brink@wur.nl | |||
{|class="wikitable" style="margin: auto; background-color:#ffffcc;" | {|class="wikitable" style="margin: auto; background-color:#ffffcc;" | ||
Revision as of 13:34, 3 March 2021
Use-case 2: “Planting Trees to Reduce Heat Stress”
Background Information / comparison with last year

Content of the course
General information
- Name of the course:"Geo-information Science BSc research project"
- Study-major: Geo-information for Environment and Society
- Study programme: Bachelor's International Land and Water Management
- Educational Institute: Wageningen University & Research
Target students
Students need GIS skills For the Tygron, you don't really need that. ArcGIS Pro
Objectives and desired outcome
Apply GIS and remote sensing to real life projects through research.
After successful completion of this course students are expected to be able to: - outline and structure a limited spatial research project; - interpret and restate research objectives in research questions; - review and report current research related to the research project; - design and develop a spatial data processing method or remote sensing processing method that can be applied to the research problem; - use a GIS or Remote Sensing application to explore or analyse a limited spatial research issue; - examine and interpret the results and infer relevant conclusion relevant to the research objectives.
Activities: Simulating a limited research project setting under supervision. Given a specific project description the student has to find and read project related publications, analyse project related data, use applicable software and report findings.
Outcome: A research paper, more like a small project (small thesis), preparation for the thesis. Students can choose any subject that is related to GIS or remote sensing.
Design of the Course
Syllabus and time distribution
As a final course of the GRS-minor students carry out individually a small individual research project given a limited project description. Within a short amount of time students are expected to realize some research stages like the interpretation of a project description, outline research tasks, analyse geo data, run geo data processing application and write a report about the followed methodology and findings.
The course was given in English and was spread over 4 weeks (full-time) Heat stress template to get to know the heat overlay Individual research Bachelor (WO) 3rd year (last year) 6 credits
Guidance and resources
1 week to find out what the student wants to research and to get the license from the university 1 day to get to know Tygron, but it took 1 week to know what to do with it (exporting results, recording, etc.)
Relevant Resources:
- Sun motion table (heat overlay)
- Heat Stress module overview
- How to calculate the hourly radiation
- Geo Data
- DPRA Heat Module
- Model attributes (heat overlay)
- How to calculate the daily average radiation
- Project Sources
- Foliage crown factor (heat overlay)
Outcome and Assessment
Research question: What is the most effective way to place trees to reduce the PET during a heat wave in Utrecht?
- What is the effect of trees planted in rows along roads, on the reduction of the PET during a heat wave, in Utrecht?
- What is the effect of trees planted in groups, on the reduction of the PET during a heat wave, in Utrecht?
- Tygron Model showing the heat stress in the Rivierenwijk at 14:00 using the DPRA Heat Module
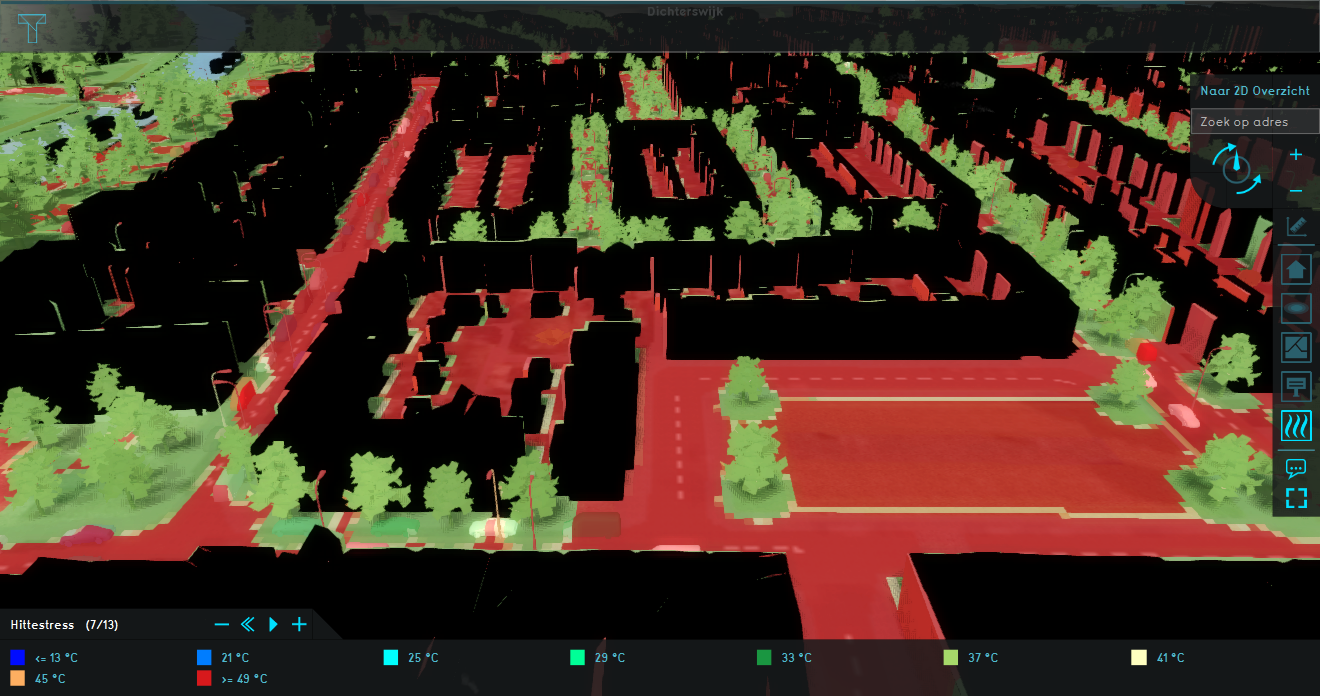
Current situation
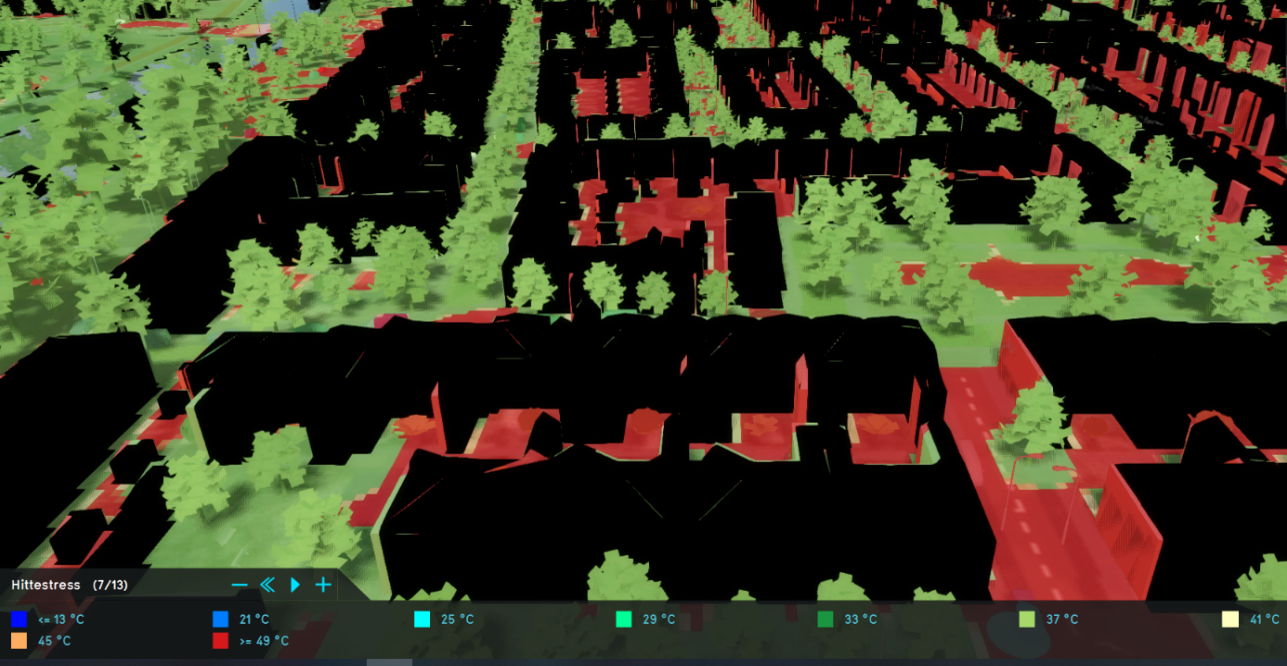
Situation with trees placed in lanes
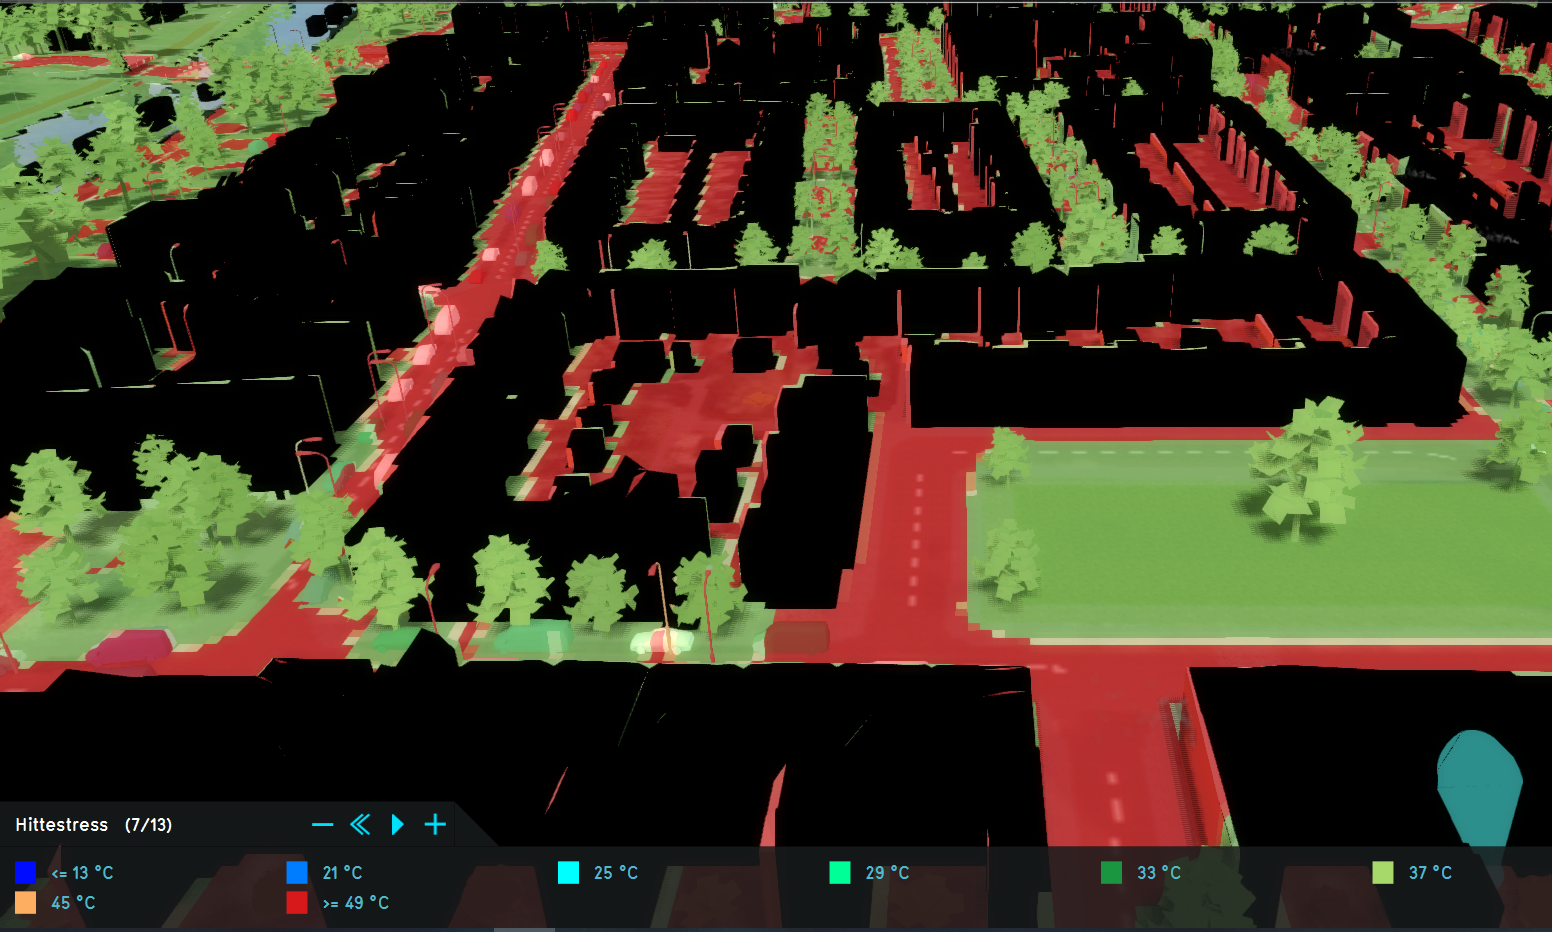
Situation with trees placed in groups


File:Report GIS BSc Research Project Max Brink.pdf
- Maps showing the PET (Physiological Equivalent Temperature) heat stress in the Rivierenwijk at 17:00
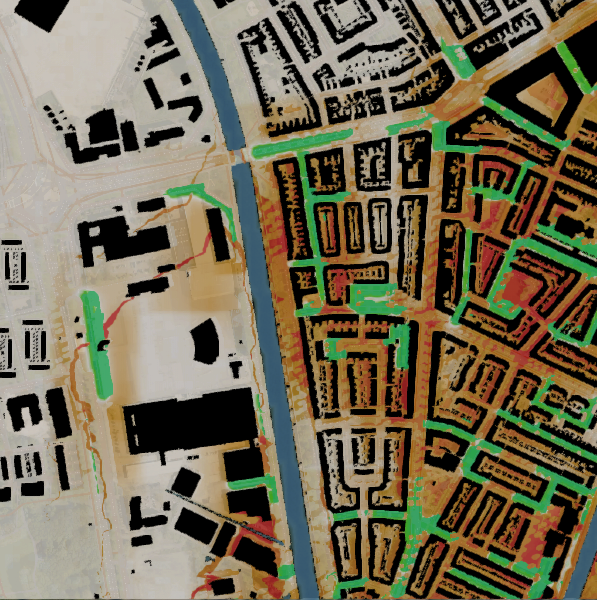
Situation with trees placed in lanes
Situation with trees placed in groups


Feedback and recommendations
The Tygron Geodesign Platform is nowadays mainly used by municipalities, water boards and provinces for discussions about certain land use decisions. However, as this project has shown, the options for using the validated overlays, such as the Heat Overlay, make the platform also suitable for research projects.

Max Brink, WUR
Contact
For more information about this course, you can contact us at: info@Tygron.com
You can also reach Max Brink, the student who used Tygron in this course: max.brink@wur.nl
| <<Previous page | Next page>> |