How to show polygon data in Power BI: Difference between revisions
Jump to navigation
Jump to search
No edit summary |
No edit summary |
||
| (9 intermediate revisions by the same user not shown) | |||
| Line 1: | Line 1: | ||
<youtube></youtube> | <youtube>https://youtu.be/FuGV-IGJ44g</youtube> | ||
{{editor location|neighborhoods}} | {{editor location|neighborhoods}} | ||
| Line 26: | Line 26: | ||
}} | }} | ||
{{gallery | |||
|Icon_Map_app.JPG|Icon Map app page in Power BI app store | |||
|Icon_Map_visual.JPG|Icon Map visual button | |||
|Icon_Map_config.JPG|Icon Map configuration for Neighborhoods | |||
|WGS_84_CRS_select.JPG|WGS 84 CRS selection | |||
|Export_wgs_84_neighborhoods.JPG|Export panel for neighborhoods | |||
|Icon_Map_Format_Visual_GeoJSON.JPG|Icon Map Format Visual GeoJSON section | |||
|Icon_Map_Visualization.JPG|Icon Map Visualization | |||
}} | |||
{{article end | {{article end | ||
|howtos= | |howtos=* [[How to access your project data in Power BI]] | ||
* [[How to access your project data in Power BI]] | * [[How to show Indicator results in Power BI]] | ||
* [[How to show Overlays in Power BI]] | |||
|seealso= | |seealso= | ||
* [[Power BI]] | * [[Power BI]] | ||
* [[GeoJSON]] | * [[GeoJSON]] | ||
|notes= | |notes= | ||
[[File:Icon_Map_GeoJSON_gradient.jpg|thumb|right]] | |||
* In the format section of Format your Visuals, you can also customize the coloring of the shapes based on the value of a feature property. | |||
* Icon Maps currently only seem to be able to visualize GeoJSONs exported using the CRS 4326. | * Icon Maps currently only seem to be able to visualize GeoJSONs exported using the CRS 4326. | ||
}} | }} | ||
[[Category:How-to's]] | |||
Latest revision as of 16:15, 30 January 2024
Editor → Current Situation (Ribbon tab) → Administrative (Ribbon bar) → Show Neighborhoods (Dropdown)
How to show polygon data in Power BI:
- Open or create a Power BI project that has a web connection to Neighborhoods of a project session. See this How-to;
- Select the visuals tab in your Power BI Project
- Click on the triple dots icon named "Get More Visuals" and select the option "Get More Visuals".
- In the search field, type "Icon" and select the "Icon Maps" app.
- On the Icon Map app page, click on the "Add" button.
- Unfold the "Neighborhoods" data connection
- Find and drag the features.properties.NAME attribute to the Category field.
- Select a numerical property, such as feature.properties.ACTIVE and drag it to the Size field.
- The Icon Map should now show a map, but not yet the shapes of the neighborhoods.
- Select the "Format your visual" tab and unfold the GeoJSON section.
- Click on the Off button to activate it.
- Switch to the Tygron Client Application to a Neighborhood GeoJSON endpoint.
- Select Current Situation in the Ribbon bar
- Hover over Administrative and under Neighborhoods, select Export Geo data.
- In the Export Geo Data panel, set the type to GeoJSON (MultiPolygons).
- Verify that the export CRS is set to 4326. If not, click on the edit link.
- In the CRS selection panel, type 4326 and press enter.
- Wait for the process to finish and select the WGS84 CRS with the number 4326 and confirm with select.
- Click on the Copy URL button next to GeoJSON endpoint.
- Switch back to Power BI and paste the link in the URL field in the GeoJSON we had previously activated. (Use CTRL-V)
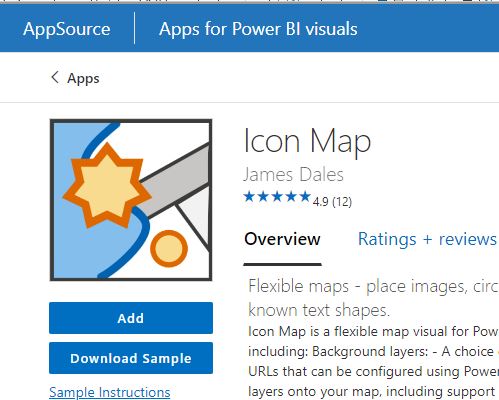
Icon Map app page in Power BI app store
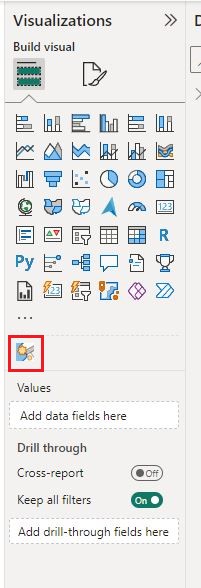
Icon Map visual button
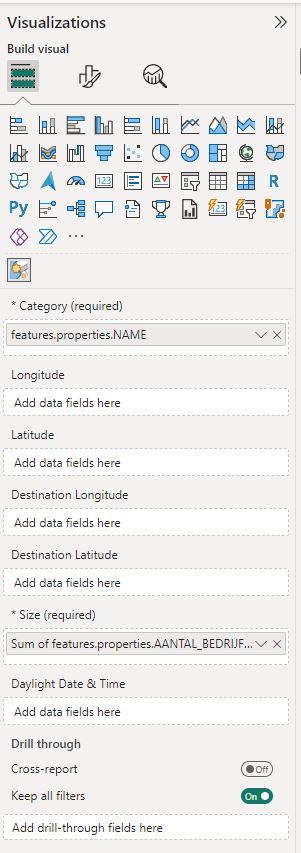
Icon Map configuration for Neighborhoods
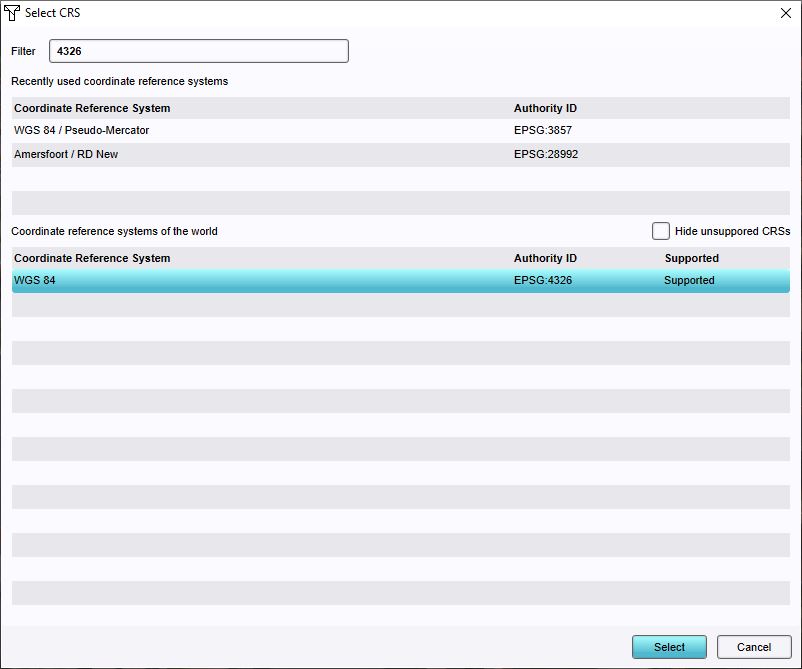
WGS 84 CRS selection
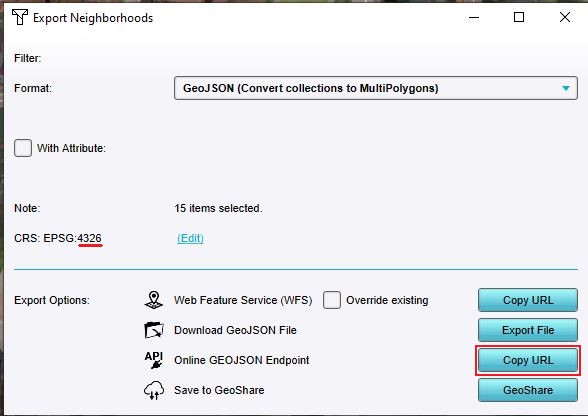
Export panel for neighborhoods
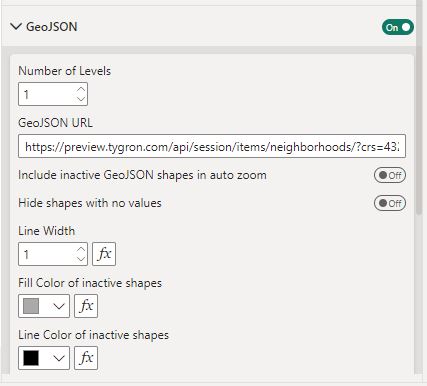
Icon Map Format Visual GeoJSON section
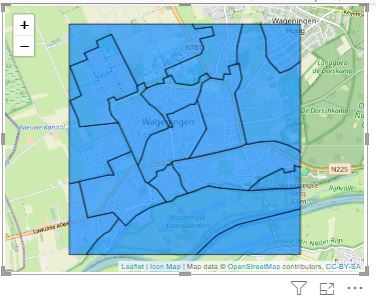
Icon Map Visualization


Notes

- In the format section of Format your Visuals, you can also customize the coloring of the shapes based on the value of a feature property.
- Icon Maps currently only seem to be able to visualize GeoJSONs exported using the CRS 4326.
How-to's
- How to access your project data in Power BI
- How to show Indicator results in Power BI
- How to show Overlays in Power BI