Demo Heat Stress Project
| Next page>> |
About the project
The Demo Heat Stress project is available for all users in the trial version and can be found in the main menu under Edit projects. The demo is a working project in which the DPRA Heat Stress module is used to vizualize and analize the heat stress in het Wageningen area. This project area is choosen because this area is used for the Dutch benchmark for the DPRA Heat Stress model. In this demo project some adjustments have been made in comparisson with the benchmark project. If you want more information on the actual benchmark project please contact us via our forum.
Demo Heat Stress

The project shows the Wageningen area which is a combination of an urban environment and a rural area. In this Demo project the heat stress on August second 2013 between 12 PM and 6 PM is vizualized. This date is picked to be the benchmark for this model. In the Tygron Platform it is possible to select your own date('s) and time over which you want to analize the heat stress. In the heat stress tutorial you can learn how to change these settings.
Analyse the project
Explore the current situation
- Zoom and click around in the project to inspect the 3D model.
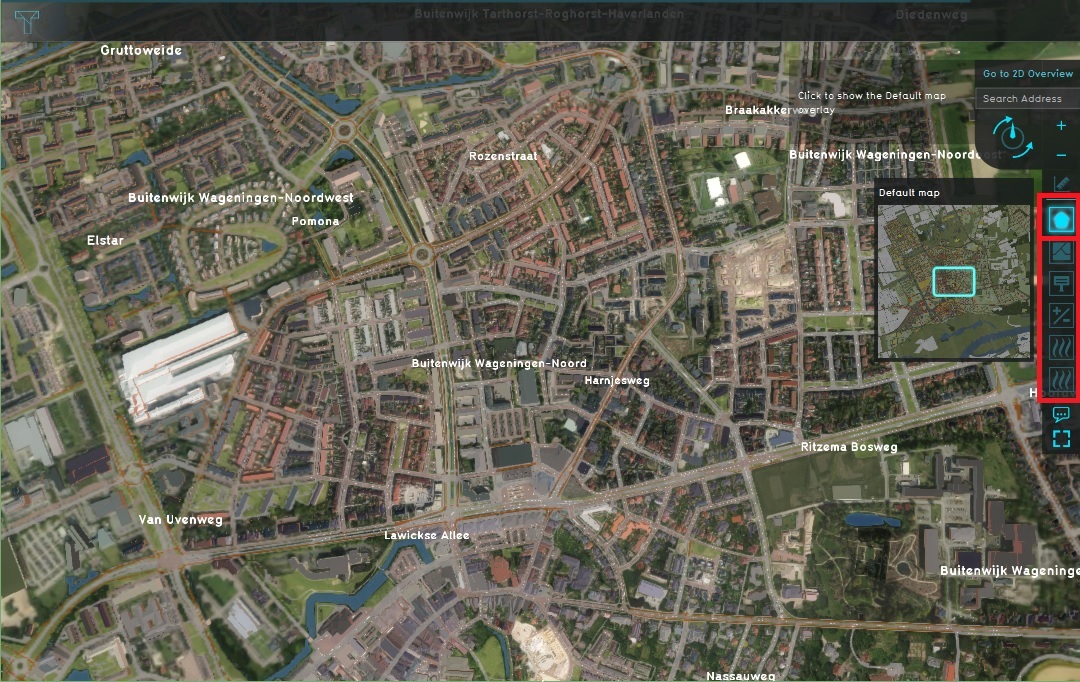
- Zoom out and observe the current situation. By default you start in the default map. On the right side of the project area you see the bar with overlays. Click on a few overlays to see the information you can get about the current situation.
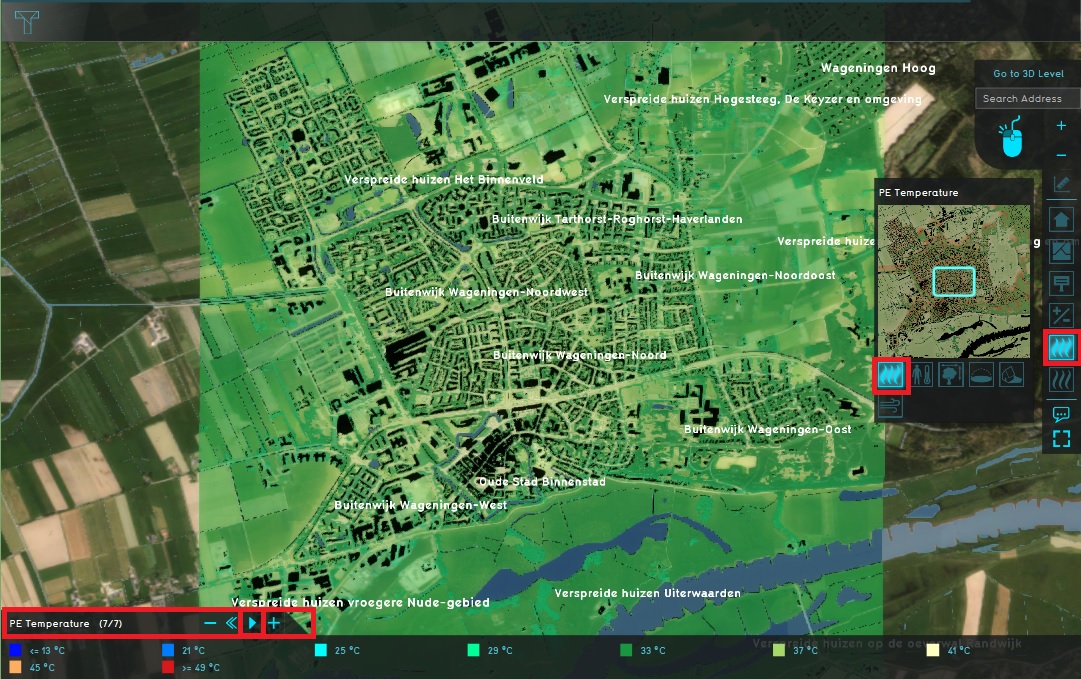
- Now open the PE Temperature overlay by clikking on the Heat Stress icon and notice the PE temperature overlay is visible in the project area, and in the minimap of the overlay in the overlay bar some new overlays are visible.
- The first child overlay is the PE Temperature overlay, this one is already selected. These overlay can show the level of heat stress over time. In this case on August second 2013 between 12 PM and 6 PM. After clicking the play button the overlay will show the time frames per hour of the heat stress level at that exact time. Select the play button and notice the results over time in the overlay.
- Select the second child overlay, the Foliage, and activate the overlay results by selecting the play button. Notice this overlay does not show a modification in the results over time. This can be explained because of the information the specific overlay shows. F.E. the foliage overlay shows the height of the trees. This does not change over a time period of 6 hours so no difference will be visible in the overlay.
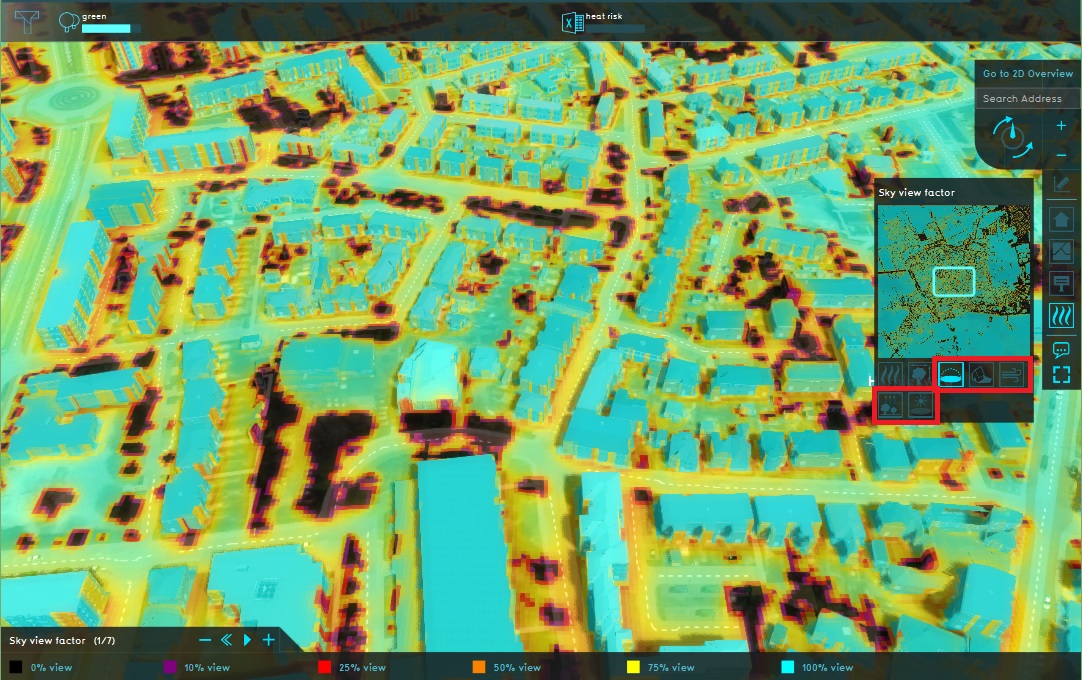
- Repeat this for all child overlays: Sky view factor, Shade, Wind speed, Bowen ratio and Urban heat island.
- As a final step for this current situation, open the green indicator in the top bar and notice the targets for this project area. F.E. for 'Oude Stad Binnenstad' the green target says in teh current situation 72 m2 green per house in this are is present and needs to be improved to 300m2 per house in this area so still 228 m2 needs to be constructed to reach this target.
2. Select serveral overlays
3. Select the PE Temperature overlay
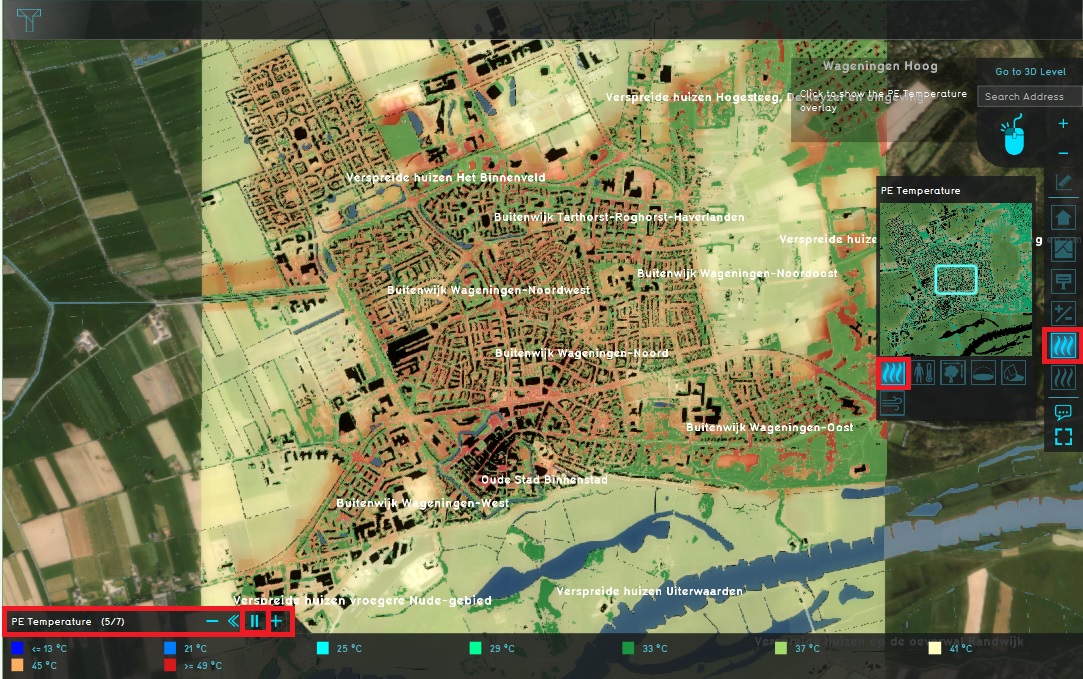
4. Notice the results over time
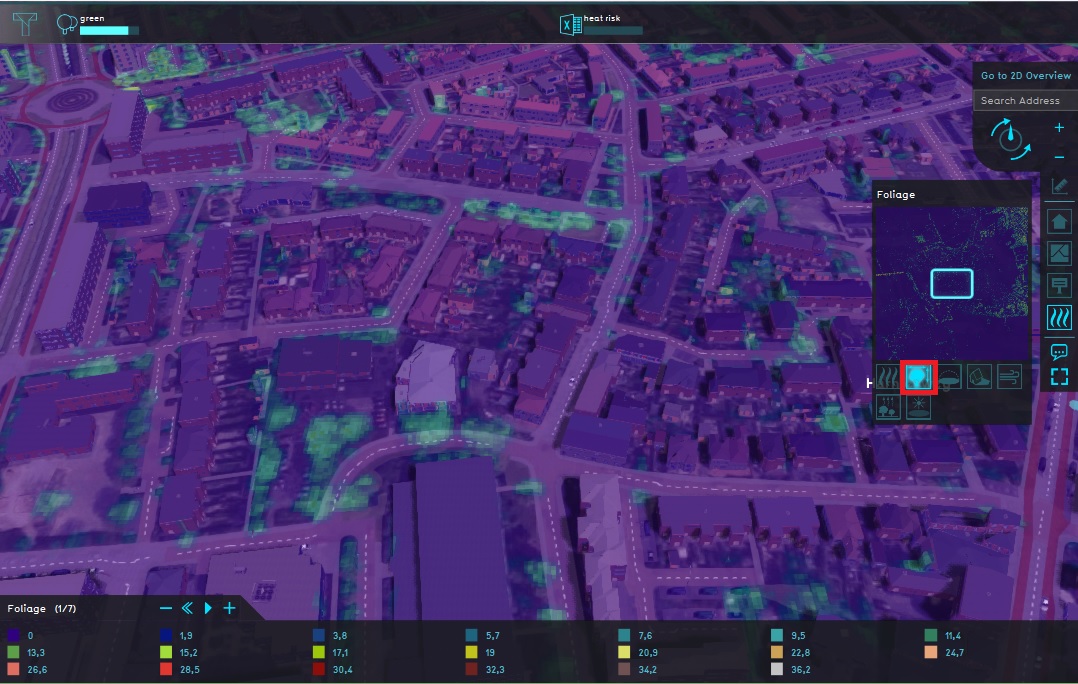
5. Select the Foliage overlay and activate the time frames
6. Other child overlays
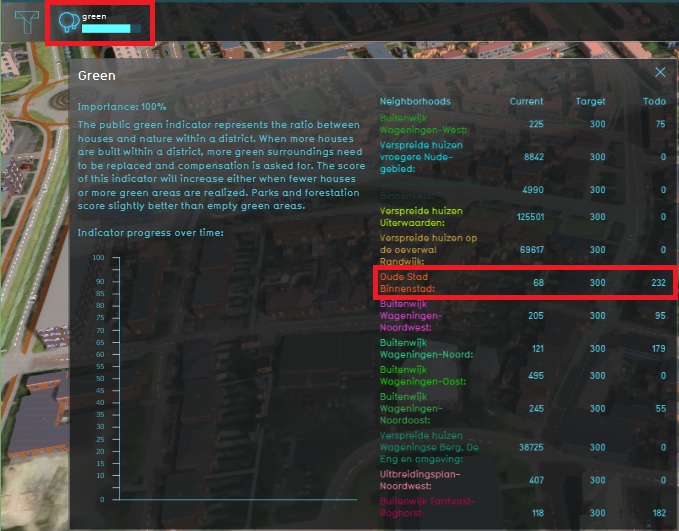
7. Open green indicator and notice target


| Next page>> |