3D Visualization: Difference between revisions
No edit summary |
No edit summary |
||
| (34 intermediate revisions by 3 users not shown) | |||
| Line 1: | Line 1: | ||
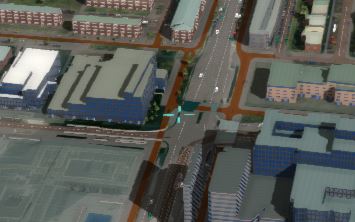
{{ | [[File:3DWorld2.jpg|right|thumb|{{software|client}}'s 3D Visualization with a textured height map, 3D building model and furniture, traffic and a skybox]] | ||
When using the [[{{software|client}}]], a three dimensional (3D) visualization of the selected [[project]] is rendered as a scene. | |||
The view into this 3D visualization is determined by the selected [[Camera]] mode, which also determine the way you can navigate using the mouse and keyboard controls. | |||
The scene consists of: | |||
* A textured height map, based on the [[DTM]], [[Terrain]]s and [[Building]]s on top of it. | |||
* Construction and furniture models of [[Building]]s. | |||
* [[Traffic Model|Traffic vehicles]], either driving or stationary. | |||
* A sky box providing the background of the visualization. | |||
* Abstract visualizations, such as [[Network]] and [[System_visualization_(Water_Overlay)|Water System visualization]], based on the selected [[Water Overlay]]. | |||
* Labels indicator [[Neighborhood]]s and street names. | |||
* Informational [[popup]]s on locations of interest. | |||
* Shaders that enhance the visualization, such as water and shadows and the cursor location. | |||
* [[Flooding Overlay|Flooding]] and [[weather]] effects. | |||
* Special effects placed in the projects, spawning particles such as smoke. | |||
* Visualize [[Overlay]]s. These overlays can also be inspected by interacting with the scene to show hover information of clicked locations. | |||
: | ==Cursor highlight== | ||
[[File:cursor_highlight_3D_visualization.jpg|thumb|right|The cursor highlight in the 3D Visualization.]] | |||
The Cursor highlight indicates the location of interaction with the 3D Visualization. For example when inspecting the data by left clicking, a hover menu will open with data at the location of the highlighted cursor. There can be a slight delay between the location of the cursor of your operating system, and the cursor in the 3D visualization. | |||
== | ==Actions and Selection== | ||
Users can draw and perform actions on both the [[Current Situation]] and [[Future Design]]. The effects of these actions will be visualized either directly or after calculation of the projects [[Overlay]]s, [[Panel]]s and [[Indicator]]s. It is possible to continuously switch between the current and future situation and see differences made. Furthermore, certain actions and events can be fired to activate special visual effects, such as a flood calculated by a Flooding overlay, visualized using a water shader. | |||
==Interface== | |||
[[ | On top of the 3D visualization, depending on the type of [[session]], a [[Viewer ]]interface and optionally an [[Editor ]]interface is rendered. This interface can be used to interact with the project or start actions in the 3D visualization. | ||
= | {{article end | ||
|seealso= | |||
* [[Viewer]] | |||
* [[Editor]] | |||
* [[Camera]] | |||
* [[List of Keyboard Shortcuts]] | |||
* [[Virtual Reality]] | |||
}} | |||
Latest revision as of 15:26, 1 February 2024
When using the Tygron Client, a three dimensional (3D) visualization of the selected project is rendered as a scene.
The view into this 3D visualization is determined by the selected Camera mode, which also determine the way you can navigate using the mouse and keyboard controls.
The scene consists of:
- A textured height map, based on the DTM, Terrains and Buildings on top of it.
- Construction and furniture models of Buildings.
- Traffic vehicles, either driving or stationary.
- A sky box providing the background of the visualization.
- Abstract visualizations, such as Network and Water System visualization, based on the selected Water Overlay.
- Labels indicator Neighborhoods and street names.
- Informational popups on locations of interest.
- Shaders that enhance the visualization, such as water and shadows and the cursor location.
- Flooding and weather effects.
- Special effects placed in the projects, spawning particles such as smoke.
- Visualize Overlays. These overlays can also be inspected by interacting with the scene to show hover information of clicked locations.
Cursor highlight
The Cursor highlight indicates the location of interaction with the 3D Visualization. For example when inspecting the data by left clicking, a hover menu will open with data at the location of the highlighted cursor. There can be a slight delay between the location of the cursor of your operating system, and the cursor in the 3D visualization.
Actions and Selection
Users can draw and perform actions on both the Current Situation and Future Design. The effects of these actions will be visualized either directly or after calculation of the projects Overlays, Panels and Indicators. It is possible to continuously switch between the current and future situation and see differences made. Furthermore, certain actions and events can be fired to activate special visual effects, such as a flood calculated by a Flooding overlay, visualized using a water shader.
Interface
On top of the 3D visualization, depending on the type of session, a Viewer interface and optionally an Editor interface is rendered. This interface can be used to interact with the project or start actions in the 3D visualization.

