Tygron for GIS Data
Use-case 2: “Planting Trees to Reduce Heat Stress”
Background Information / comparison with last year
Content of the course
General information
- Name of the course:"Geo-information Science BSc research project"
- Study-major: Geo-information for Environment and Society
- Study programme: Bachelor's International Land and Water Management
- Educational Institute: Wageningen University & Research
Target students
Students need GIS skills For the Tygron, you don't really need that. ArcGIS Pro Bachelor (WO) 3rd year (last year) Around 15 students
Objectives and desired outcome
Apply GIS and remote sensing to real life projects through research.
After successful completion of this course students are expected to be able to: - outline and structure a limited spatial research project; - interpret and restate research objectives in research questions; - review and report current research related to the research project; - design and develop a spatial data processing method or remote sensing processing method that can be applied to the research problem; - use a GIS or Remote Sensing application to explore or analyse a limited spatial research issue; - examine and interpret the results and infer relevant conclusion relevant to the research objectives.
Activities: Simulating a limited research project setting under supervision. Given a specific project description the student has to find and read project related publications, analyse project related data, use applicable software and report findings.
Outcome: A research paper, more like a small project (small thesis), preparation for the thesis. Students can choose any subject that is related to GIS or remote sensing.
Design of the Course
Syllabus and time distribution
As a final course of the GRS-minor students carry out individually a small individual research project given a limited project description. Within a short amount of time students are expected to realize some research stages like the interpretation of a project description, outline research tasks, analyse geo data, run geo data processing application and write a report about the followed methodology and findings. Course only had an introduction lecture + a final lecture with presentation of results. The course was given in English and was spread over 4 weeks (full-time) self monitored. Heat stress template to get to know the heat overlay Individual research 6 credits Using other platforms, students were working on subjects like deforestation, remote sensing for agriculture, landscape architecture.
Guidance and resources
1 week to find out what the student wants to research and to get the license from the university Student used the heat stress template to explore the overlays, but he did not use it for the research. 1 day to get to know Tygron, but it took 1 week to know what to do with it (exporting results, recording, etc.) Used the wiki very much, demo, q&A and mainly the following wiki tutorials:
- Sun motion table (heat overlay)
- Heat Stress module overview
- How to calculate the hourly radiation
- Geo Data
- DPRA Heat Module
- Model attributes (heat overlay)
- How to calculate the daily average radiation
- Project Sources
- Foliage crown factor (heat overlay)
About the data: The student also used Tygron's heat overlay wizard to import data manually. He used the weather data from the Royal Netherlands Meteorological Institute (KNMI) Student used his own laptop Student did not need support from Tygron
Outcome and Assessment
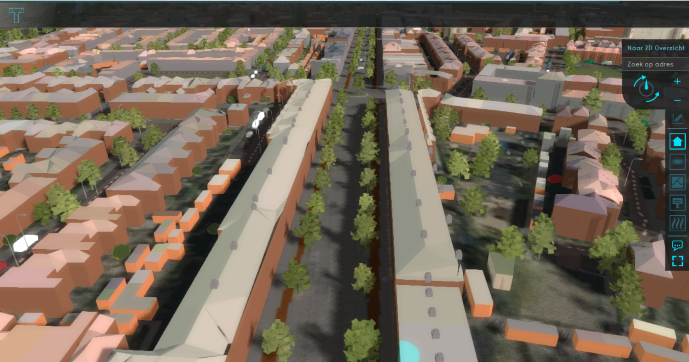
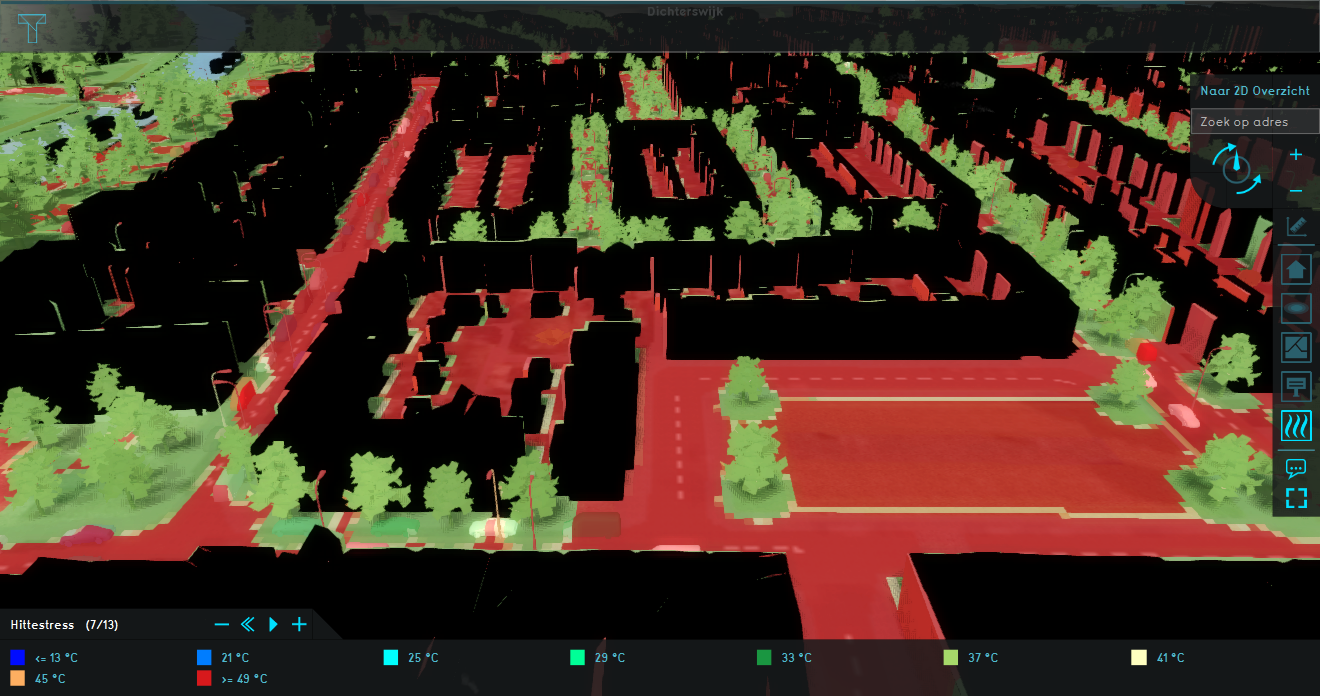
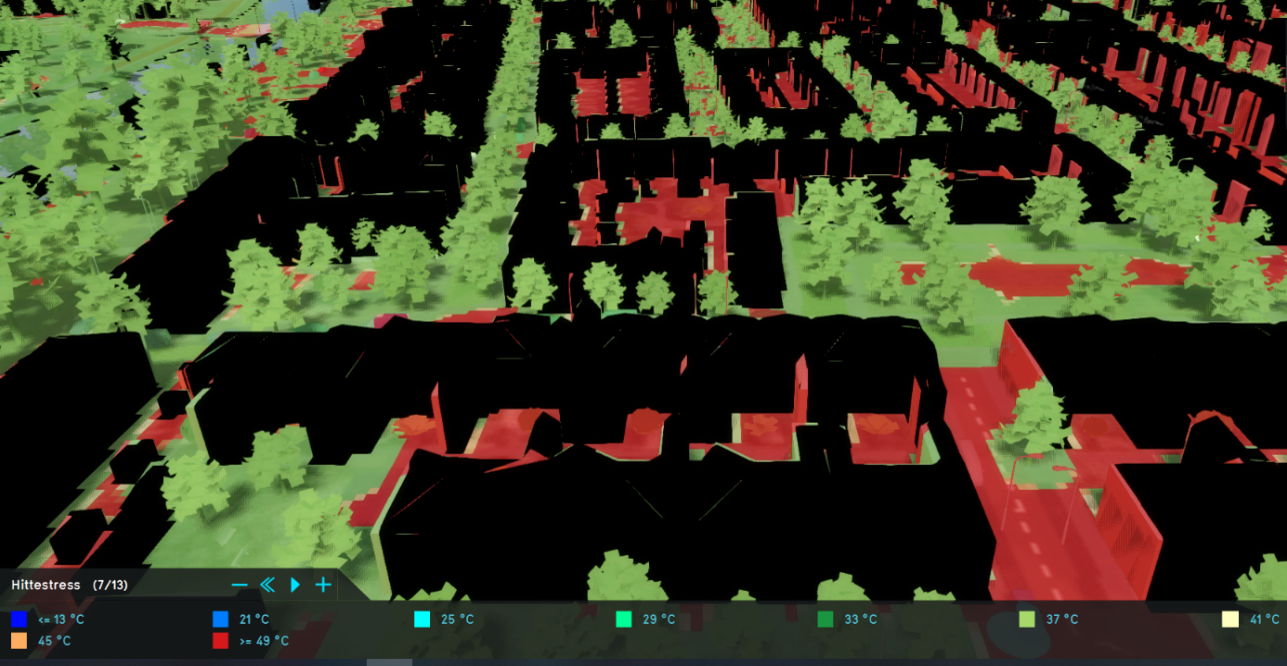
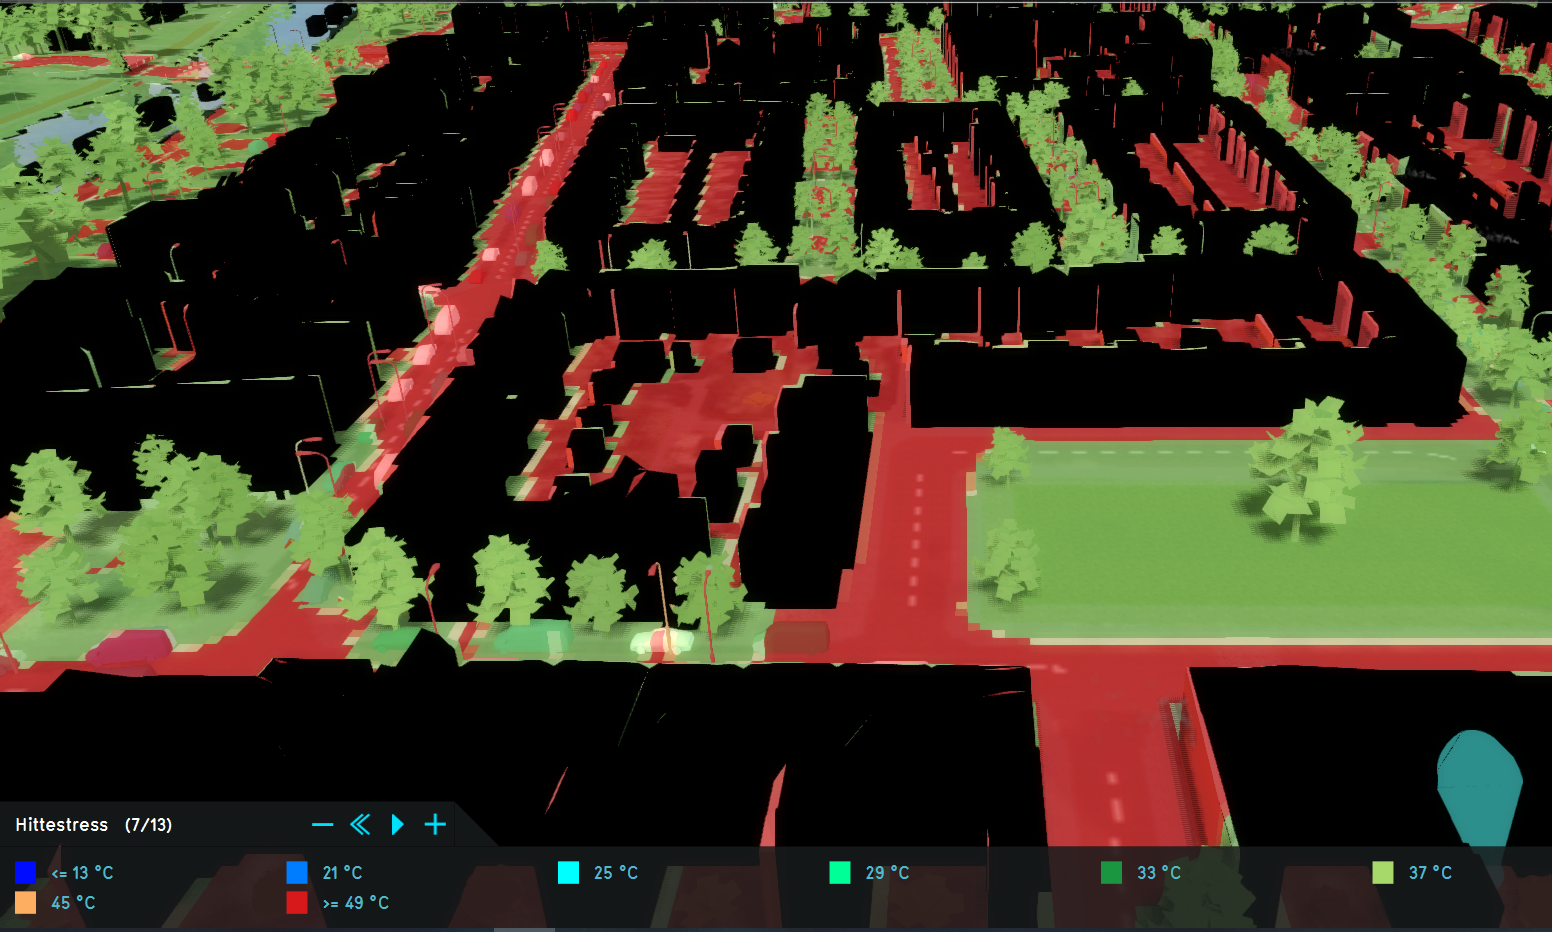
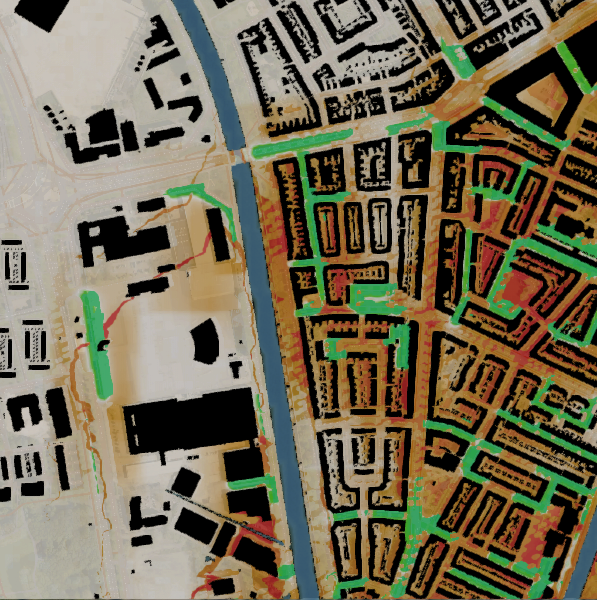
Research question: What is the most effective way to place trees to reduce the PET during a heat wave in Utrecht?
- What is the effect of trees planted in rows along roads, on the reduction of the PET during a heat wave, in Utrecht?
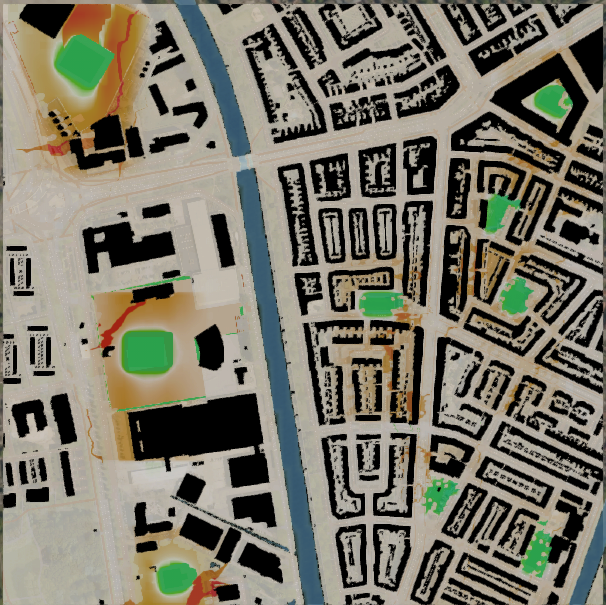
- What is the effect of trees planted in groups, on the reduction of the PET during a heat wave, in Utrecht?
Student was able to answer his research question because placing the trees was possible with Tygron. To present the finding, the student created: - A presentation at the end of the course - A Research Paper - A StoryMap (not mandatory)
Unexpected result: was surprised Trees could have a negative effect on the heat stress because of the decrease in wind speed.
File:Report GIS BSc Research Project Max Brink.pdf
Feedback and recommendations
- Maximum size allowed for edu license 1 x 1 (1 sqkm). The neighborhood did not fit into the maximum side. He had to clip out some of neighborhood for the analysis - No problems collecting data. - No technical difficulties despite being a heavy programme. - Test run was confusing because when you end the test-run, it goes back. - This could be fixed by saving different versions. - It was nice to work on something individual - For this assignment, the student believe that the time given (4 self-monitored weeks) was very sufficient. - Overlays are very useful for research. - Learning Tygron has created an internship opportunity for Max. - The wiki offers very extensive explanations about the heat overlays and they work (they are based on government reports). This is very valuable for researchers because they can use the wiki as a reference in their methodology section. - The Tygron platform is very time-saving for researchers, especially with calculations
The Tygron Geodesign Platform is nowadays mainly used by municipalities, water boards and provinces for discussions about certain land use decisions. However, as this project has shown, the options for using the validated overlays, such as the Heat Overlay, make the platform also suitable for research projects.

Max Brink, WUR
It was really nice to have so much details and to use all these different factors like wind, UHIF and all other factors in one project without requiring a lot of time, because a lot of things are already in Tygron.
Contact
For more information about this course, you can contact us at: info@Tygron.com
You can also reach Max Brink, the student who used Tygron in this course: max.brink@wur.nl
| <<Previous page | Next page>> |
