Heat Reduction (Indicator): Difference between revisions
No edit summary |
|||
| (2 intermediate revisions by one other user not shown) | |||
| Line 1: | Line 1: | ||
The Heat Reduction indicator computes the effect of urban green on heat reduction. The presence of green reduces heat stress in the surrounding area and therefore cools down the environment. The more urban green space is present in an area, the stronger the heat reduction in that area will be. | The Heat Reduction indicator computes the effect of urban green on heat reduction. The presence of green reduces heat stress in the surrounding area and therefore cools down the environment. The more urban green space is present in an area, the stronger the heat reduction in that area will be. | ||
This indicator is a simplified version of a RIVM calculation model and was created for a pilot with the RIVM. The indicators in this pilot are co-created with the RIVM, according to their (calculation) methods. | This indicator is a simplified version of a RIVM calculation model and was created for a pilot with the RIVM. The indicators in this pilot are co-created with the RIVM, according to their (calculation) methods. However, these indicators have not been formally validated against RIVM standards, as they were developed specifically for the pilot project. More information about this pilot and demo project is available{{ref|heat-blog}}. | ||
This indicator is useful for projects where for example: | This indicator is useful for projects where for example: | ||
| Line 24: | Line 24: | ||
The calculations used in this indicator are based on the RIVM calculations on urban green and health effects{{ref|RIVM}}. | The calculations used in this indicator are based on the RIVM calculations on urban green and health effects{{ref|RIVM}}. | ||
{{code|1= | {{code|1= | ||
GreenFraction = GreenArea / TotalArea | |||
AverageTemperature = ( | AverageTemperature = (GreenFraction x 100) x GREEN_HEAT_REDUCTION | ||
Temperature = AverageTemperature x NeighborhoodArea | Temperature = AverageTemperature x NeighborhoodArea | ||
}} | }} | ||
| Line 32: | Line 32: | ||
*GreenArea: the calculated [[Select lotsize (TQL)|lotsize]] in a neighborhood, with each lot multiplied by its [[Vegetation fraction (Function Value)|vegetation fraction]]. | *GreenArea: the calculated [[Select lotsize (TQL)|lotsize]] in a neighborhood, with each lot multiplied by its [[Vegetation fraction (Function Value)|vegetation fraction]]. | ||
*TotalArea: is the size of the entire area (m²) specified in the project | *TotalArea: is the size of the entire area (m²) specified in the project | ||
* | *GreenFraction: is the fraction of urban green in a neighborhood | ||
*GREEN_HEAT_REDUCTION: is an indicator attribute that indicates the | *GREEN_HEAT_REDUCTION: is an indicator attribute that indicates the heat reduction per percent of green that urban green space has in the selected neighborhood | ||
*AverageTemperature: is the average temperature in the selected neighborhood | *AverageTemperature: is the average temperature in the selected neighborhood | ||
*NeighborhoodArea: is the size (m²) of the selected neighborhood | *NeighborhoodArea: is the size (m²) of the selected neighborhood | ||
Latest revision as of 04:28, 8 July 2026
The Heat Reduction indicator computes the effect of urban green on heat reduction. The presence of green reduces heat stress in the surrounding area and therefore cools down the environment. The more urban green space is present in an area, the stronger the heat reduction in that area will be.
This indicator is a simplified version of a RIVM calculation model and was created for a pilot with the RIVM. The indicators in this pilot are co-created with the RIVM, according to their (calculation) methods. However, these indicators have not been formally validated against RIVM standards, as they were developed specifically for the pilot project. More information about this pilot and demo project is available[1].
This indicator is useful for projects where for example:
- reducing heat stress is an important goal in the project
- livability is measured in the project
The Excel indicator can be downloaded from the Public GeoShare. Read on to find out more about the indicator's calculation method and how to set it up in your project.
Indicator panel

The indicator panel shows per neighborhood:
- The name of the neighborhood
- The fraction of urban green space in that neighborhood in the future (planned) situation
- The temperature in that neighborhood in the future (planned) situation
- The average heat reduction in the entire project area
- The target temperature reduction (calculated as 100% GREEN_HEAT_REDUCTION, adjustable as an Indicator attribute)
Calculation
The calculations used in this indicator are based on the RIVM calculations on urban green and health effects[2].
GreenFraction = GreenArea / TotalArea
AverageTemperature = (GreenFraction x 100) x GREEN_HEAT_REDUCTION
Temperature = AverageTemperature x NeighborhoodArea
Where the variables are:
- GreenArea: the calculated lotsize in a neighborhood, with each lot multiplied by its vegetation fraction.
- TotalArea: is the size of the entire area (m²) specified in the project
- GreenFraction: is the fraction of urban green in a neighborhood
- GREEN_HEAT_REDUCTION: is an indicator attribute that indicates the heat reduction per percent of green that urban green space has in the selected neighborhood
- AverageTemperature: is the average temperature in the selected neighborhood
- NeighborhoodArea: is the size (m²) of the selected neighborhood
- Temperature: is the calculated temperature for the entire project area
Score
The score is based on the present urban green spaces in the specified project area. The effect that these urban green spaces have on the heat reduction is visible as the score of the indicator. For each neighborhood the score is based on the average temperature. For the totality of the project area, the average temperatures per neighborhood are weighed by the size of the neighborhood. In other words, the average temperature in a large neighborhood has a greater impact on the final score than that of a smaller neighborhood.
Additional configurations
Add the Indicator Attribute
The Indicator attribute GREEN_HEAT_REDUCTION represents the heat reduction per urban green space fraction in a specified area. It needs to be added to the project manually. The recommended value for this variable is 0.1. This value can be modified according to the needs of the project.
- Select the Heat Reduction Indicator.
- Click on the Attributes Tab
- In the new attribute name field, write GREEN_HEAT_REDUCTION.
- In the new value field, write 0.1.
- Click on the Save New Attribute button to add the attribute to the indicator.
- Update the indicator by clicking on the Calculation Cloud icon in the ribbon bar.
-
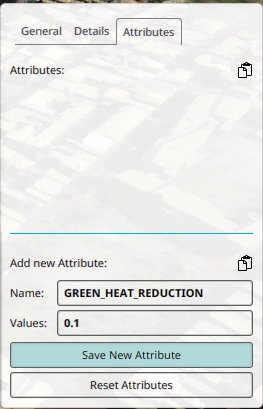 Adding the required attribute to the indicator.

References
- ↑ De economische waarde van natuurlijk kapitaal ∙ Found at: https://www.tygron.com/nl/2018/12/07/de-economische-waarde-van-natuurlijk-kapitaal/
- ↑ Natural Capital Model Technical documentation of the quantification, mapping and monetary valuation of urban ecosystem services ∙ Remme, R. (RIVM), De Nijs, T. (RIVM), & Paulin, M. (RIVM), (2018)