Top bar: Difference between revisions
No edit summary Tag: Reverted |
No edit summary |
||
| (14 intermediate revisions by 2 users not shown) | |||
| Line 1: | Line 1: | ||
{{Image with gallery|filename= | {{Image with gallery|filename=top_bar_panel.png|size=400px|filedescription=The top bar, which provides information on the stakeholders and indicators.|float=right|gallery=<gallery mode="nolines"> | ||
File:Interface_game_top_bar_-_indicator_hover_panel.jpg|Hover over an indicator | File:Interface_game_top_bar_-_indicator_hover_panel.jpg|Hover over an indicator | ||
</gallery>}} | </gallery>}} | ||
The top bar is the | The top bar is the interface element at the top of the [[Viewer ]]interface. Displayed, in order from left to right, are the [[Domain#Logo|Domain logo]], the [[stakeholders|stakeholder]] name, the time, the displayed [[Map Type]], and the [[indicators]]. The logo will also start flashing red when the computer has trouble maintaining a connection with the {{software}} server. The [[stakeholder]] name indicates which role the user has selected, and thus which party they represent during the session. Display mode allows stakeholders to visually compare the [[Future Design]] with its initial state in the [[3D Visualization]]. | ||
The right section of the top bar is entirely filled with indicators. Each indicator shows | The right section of the top bar is entirely filled with the indicators that are accessible to your stakeholder. Each indicator shows progress toward its target; hovering reveals the indicator's full name and score. | ||
{{ | {{article end | ||
|howtos= | |||
* [[How to interact with the Top Bar]] | |||
| | * [[Indicator#Relation to Stakeholders|Indicator relation to Stakeholders]] | ||
}} | }} | ||
{{ | {{Viewer nav}} | ||
}} | |||
Latest revision as of 16:11, 13 July 2026

-
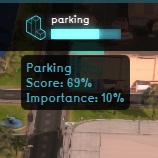 Hover over an indicator

The top bar is the interface element at the top of the Viewer interface. Displayed, in order from left to right, are the Domain logo, the stakeholder name, the time, the displayed Map Type, and the indicators. The logo will also start flashing red when the computer has trouble maintaining a connection with the Tygron Platform server. The stakeholder name indicates which role the user has selected, and thus which party they represent during the session. Display mode allows stakeholders to visually compare the Future Design with its initial state in the 3D Visualization.
The right section of the top bar is entirely filled with the indicators that are accessible to your stakeholder. Each indicator shows progress toward its target; hovering reveals the indicator's full name and score.