Waterway level change benchmark (Water Module): Difference between revisions
No edit summary |
No edit summary |
||
| (44 intermediate revisions by 2 users not shown) | |||
| Line 1: | Line 1: | ||
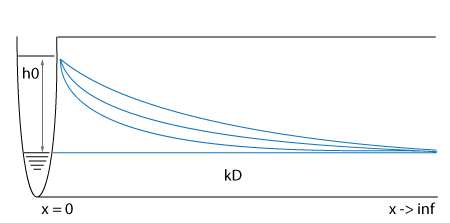
[[ | In this [[Water Module benchmarks|benchmark]], the ground water table is initially the same as the water level in the waterway. Then, the level in the waterway suddenly rises with h0 meters. This causes water to infiltrate into the ground, slowly raising the ground water table as well. | ||
[[File:water_level_change_benchmark.gif|Situation of the waterway level change benchmark for groundwater]] | |||
===Formulas=== | ===Formulas=== | ||
When the water level in the water way changes, the water table level will also change over time. The relation between water level in the waterway and the ground water table at distance x from the water way is described by the following formulas: | When the water level in the water way changes, the water table level will also change over time. The relation between water level in the waterway and the ground water table at distance x from the water way is described by the following formulas <ref name="Marsily86"/>: | ||
In case | |||
In case the water level is raised, the following formula should hold: | |||
<math> \frac{h(x)}{h_0} = erfc (x\sqrt{\frac{S}{4kDt}})</math> | <math> \frac{h(x)}{h_0} = erfc (x\sqrt{\frac{S}{4kDt}})</math> | ||
| Line 25: | Line 27: | ||
: <math>kD</math>: transmissivity of the aquifer (m2 / day) | : <math>kD</math>: transmissivity of the aquifer (m2 / day) | ||
: <math>S</math>: freatic water storage fraction. | : <math>S</math>: freatic water storage fraction. | ||
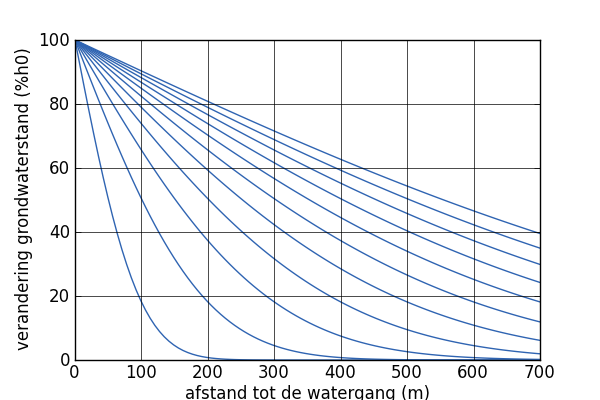
[[File:graph_waterlevel_change_percentual_over_distance.png|frame|left| De grafiek laat de relatieve verandering zien van de grondwaterstand na 1, 4, 9, 16, 25, 36, 49, 64, 81, 100 en 121 dagen, berekend met bovenstaande formule.]] | |||
<br style="clear:both"> | |||
===Setup=== | |||
The test setup uses the same parameters used in the research results published in <ref name="Ernst58"/>. | |||
The grid chosen is 112 by 5. The ground water table comparisons will be conducted in the x-direction. | |||
The grid cell size is set to 25 meters. | |||
The terrain height is set up as followed: | |||
: 0.0 m for x <= 2 | |||
: 3.0 m for x == 3 | |||
: 10.0 m for x > 3 | |||
The initial water level is set to 2, for both surface and the groundwater table, by using a water area set to 2 meters. | |||
The water will be raised to 4 meters, thereby simulating an <math>h0</math> of 2. | |||
One inlet is placed on the cells x = 1 and y = 1 to 3, with the following setup to create the sudden stable water level increment: | |||
:[[Inlet_upper_threshold_(Water_Overlay)|UPPER_THRESHOLD]] set to 4. | |||
:[[Inlet_lower_threshold_(Water_Overlay)|LOWER_THRESHOLD]] set to 4. | |||
:[[Inlet q (Water Overlay)|Inlet Q]] set to 0, such that is unlimited. | |||
This ensures that the water level is instantly raised to level 4 and that it remains at 4 at all times. | |||
The ground is setup with: | |||
[[Terrain_water_storage_percentage_(Water_Overlay)|Water storage fraction]] set to 0.25. | |||
An aquifer is added for the region as well, initialized with the [[Aquifer_kd_(Water Overlay)|Aquifer KD]] set to 700 m2/day. | |||
For the test different simulation times T are tested, each resulting in a different relation graph as shown in the described case above. | |||
A ground water overlay is used for the simulation, with a simulation time T configured using the [[Weather_rain_m_(Water_Overlay)|Weather's rain M]] parameter, set to [T, 0.0], resulting in a simulation of T seconds without rain. Note that T has to be converted to days to be used in the formula's described above. | |||
The surface water simulation mode is set to [[Surface water (Water Overlay)|surface averaging]]. | |||
===Results=== | |||
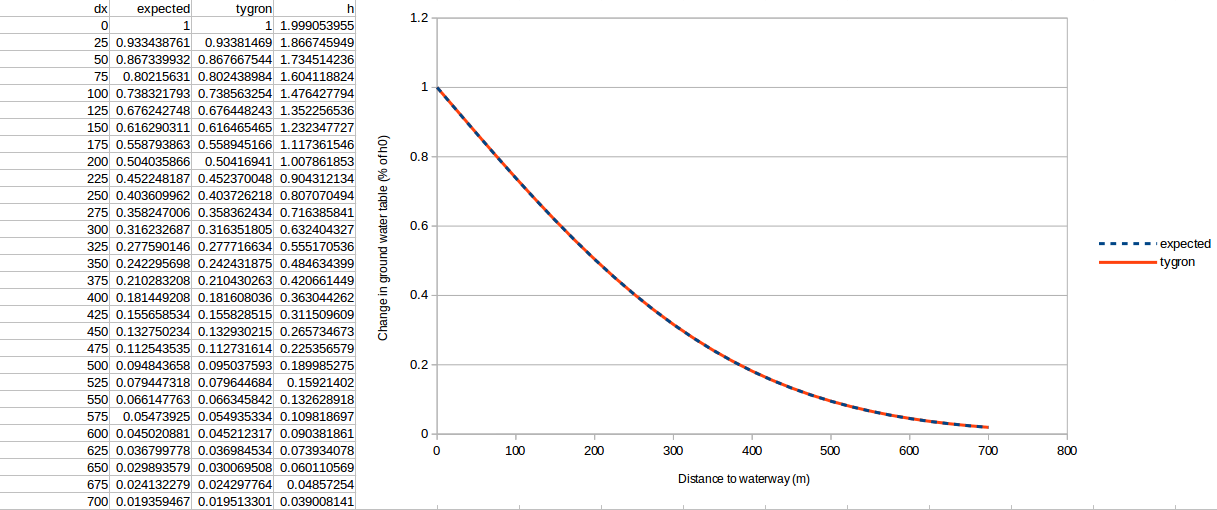
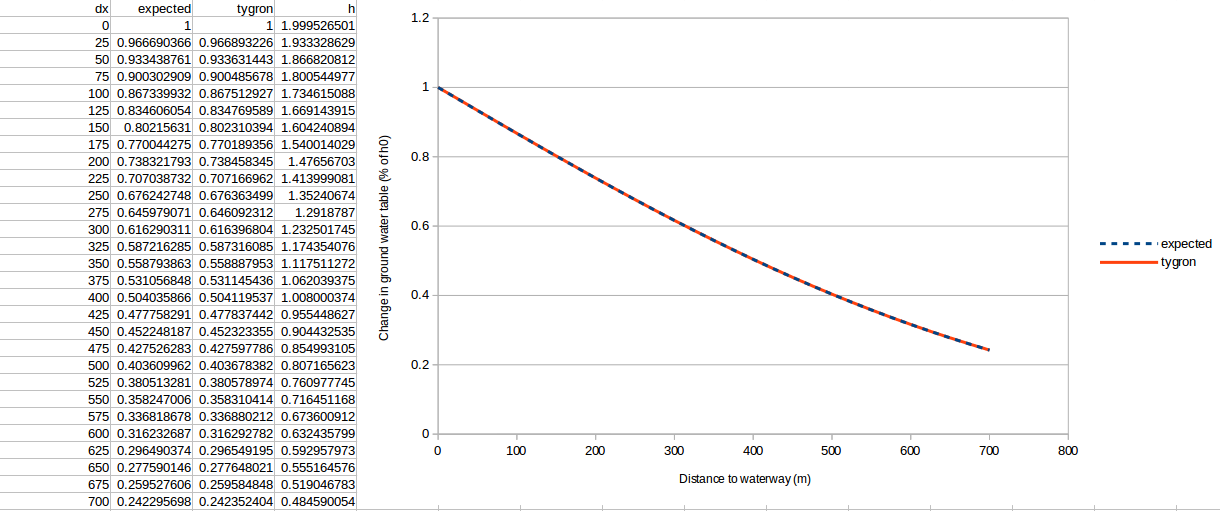
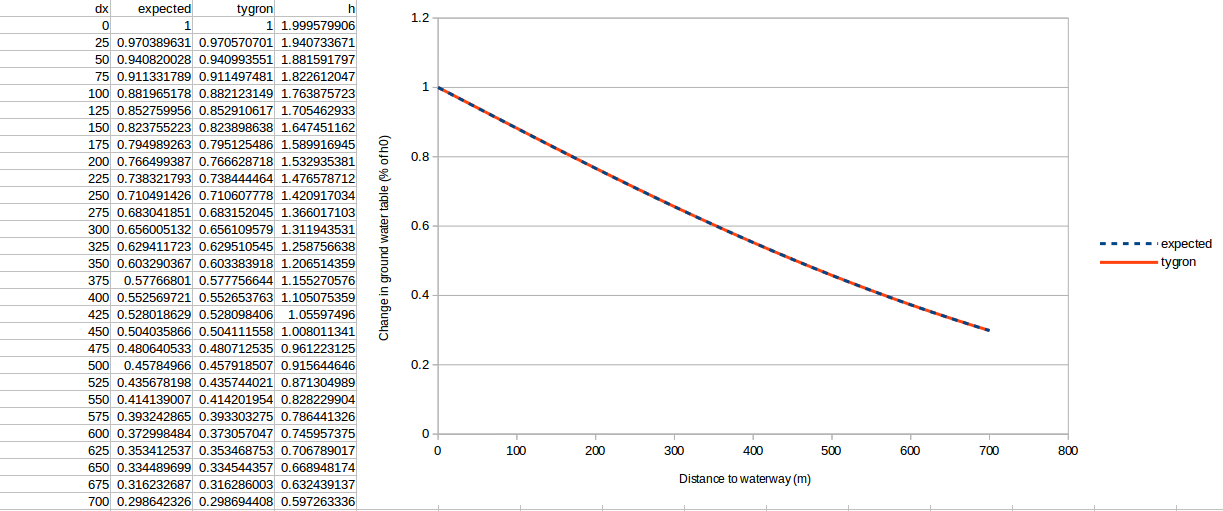
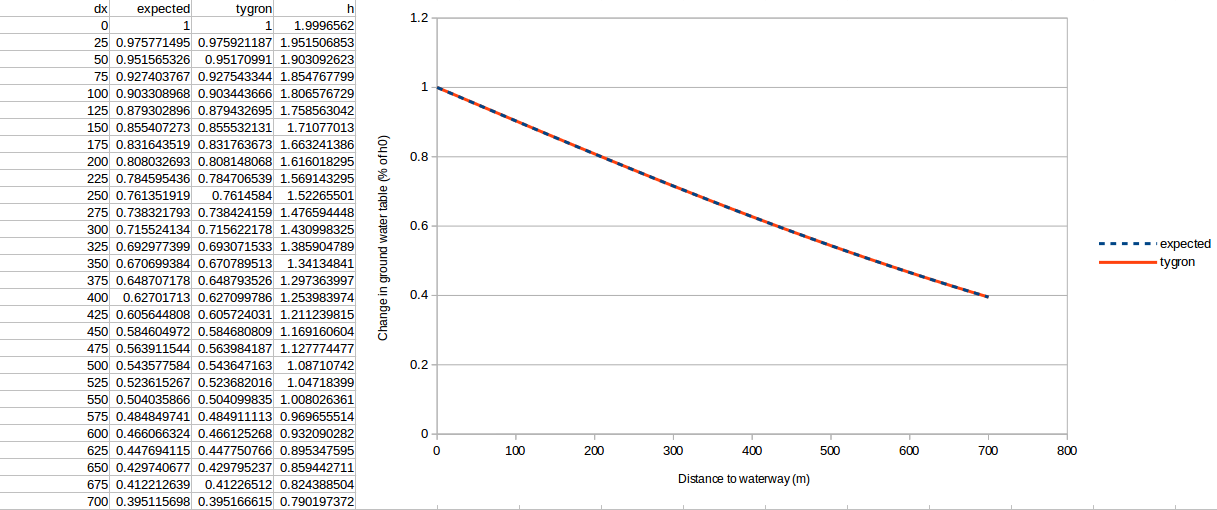
The results are generated for four simulation periods: 16 days, 64 days, 81 days and 121 days. The noted ''h'' is the increase of ground water level in meters, which went from 2 to 4 meters in the waterway. The ''dx'' is the distance in meters to the waterway. | |||
As you will be able to inspect below, the lines align very well. | |||
====16 Days==== | |||
[[File:waterway_classic_16.png]] | |||
====64 Days==== | |||
[[File:waterway_classic_64.png]] | |||
====81 Days==== | |||
[[File:waterway_classic_81.png]] | |||
====121 Days==== | |||
[[File:waterway_classic_121.png]] | |||
===References=== | |||
<references> | |||
<ref name="Ernst58"> Ernst, L.F. 1958. Verhoging van grondwaterstanden en vermindering van afvoer door opstuwing van beken. Overdruk uit Verslagen Technische Bijeenkomsten 11-12. Versl. Meded. Comm. Hydrol. Onderz. T.N.O. No. 3 (1958).</ref> | |||
<ref name="Marsily86"> Marsily, Ghislain de, 1986. Quantitative Hydrogeology. Groundwater Hydrology for Engineers. Academic Press (originally in french, p199 for the formula)</ref> | |||
</references> | |||
{{Water Module buttons}} | |||
Latest revision as of 14:48, 5 March 2024
In this benchmark, the ground water table is initially the same as the water level in the waterway. Then, the level in the waterway suddenly rises with h0 meters. This causes water to infiltrate into the ground, slowly raising the ground water table as well.
Formulas
When the water level in the water way changes, the water table level will also change over time. The relation between water level in the waterway and the ground water table at distance x from the water way is described by the following formulas [1]:
In case the water level is raised, the following formula should hold:
In case the water level is lowered, the following formula should hold:
The formula erf is the complementary error function.
where:
- : change in freatic groundwater table (m)
- : change in water level in the waterway(m)
- : distance to the water way (m)
- : time since the water level change
- : transmissivity of the aquifer (m2 / day)
- : freatic water storage fraction.
Setup
The test setup uses the same parameters used in the research results published in [2]. The grid chosen is 112 by 5. The ground water table comparisons will be conducted in the x-direction. The grid cell size is set to 25 meters.
The terrain height is set up as followed:
- 0.0 m for x <= 2
- 3.0 m for x == 3
- 10.0 m for x > 3
The initial water level is set to 2, for both surface and the groundwater table, by using a water area set to 2 meters.
The water will be raised to 4 meters, thereby simulating an of 2.
One inlet is placed on the cells x = 1 and y = 1 to 3, with the following setup to create the sudden stable water level increment:
- UPPER_THRESHOLD set to 4.
- LOWER_THRESHOLD set to 4.
- Inlet Q set to 0, such that is unlimited.
This ensures that the water level is instantly raised to level 4 and that it remains at 4 at all times.
The ground is setup with: Water storage fraction set to 0.25.
An aquifer is added for the region as well, initialized with the Aquifer KD set to 700 m2/day.
For the test different simulation times T are tested, each resulting in a different relation graph as shown in the described case above.
A ground water overlay is used for the simulation, with a simulation time T configured using the Weather's rain M parameter, set to [T, 0.0], resulting in a simulation of T seconds without rain. Note that T has to be converted to days to be used in the formula's described above.
The surface water simulation mode is set to surface averaging.
Results
The results are generated for four simulation periods: 16 days, 64 days, 81 days and 121 days. The noted h is the increase of ground water level in meters, which went from 2 to 4 meters in the waterway. The dx is the distance in meters to the waterway. As you will be able to inspect below, the lines align very well.
16 Days
64 Days
81 Days
121 Days
References
- ↑ Marsily, Ghislain de, 1986. Quantitative Hydrogeology. Groundwater Hydrology for Engineers. Academic Press (originally in french, p199 for the formula)
- ↑ Ernst, L.F. 1958. Verhoging van grondwaterstanden en vermindering van afvoer door opstuwing van beken. Overdruk uit Verslagen Technische Bijeenkomsten 11-12. Versl. Meded. Comm. Hydrol. Onderz. T.N.O. No. 3 (1958).
