Demo Heat Stress Project 2: Difference between revisions
Jump to navigation
Jump to search
Created page with "__NOTOC__ {|class="wikitable" style="margin: auto; background-color:#ffffcc;" | <<Previous page | Next page>> |} ==Wiki pages==..." |
No edit summary |
||
| (23 intermediate revisions by 5 users not shown) | |||
| Line 1: | Line 1: | ||
__NOTOC__ | __NOTOC__ | ||
{|class="wikitable" style="margin: auto; background-color:#ffffcc;" | {|class="wikitable" style="margin: auto; background-color:#ffffcc;" | ||
| [[Demo Heat Project|<<Previous page]] | | [[Demo Heat Stress Project|<<Previous page]] | ||
| [[Demo Heat FAQ | | [[Demo Heat FAQ|Next page>>]] | ||
|} | |} | ||
== | ==Explore performing actions and future scenarios== | ||
# Perform an action to modify the current situation and visualize how adjustments can improve heat stress in the project area. For this action we zoom in on a part of the map just below the middle of the map, in the old city center. This is an area which gets very hot so let's improve this part of the town. The image below shows the location on the map. | |||
# Switch back to the default map and select the [[Future Design|FUTURE DESIGN]] tab. Notice the [[Actions|action]] menu bar appeared on the left side of the map. Make sure you see the square with the church in your project area. | |||
# On the square around the church no trees are present yet. Trees reduce heat stress, so let's plant some trees. Before you can add some new trees on the square you need to demolish (a part of) the square. Select the demolish action in the action menu bar on the left side of the [[Viewer ]]interface. Notice for the drawing [[Brush|drawing tool]] the [[Brush#Polygon_pic|polygon-pick mode]] is selected, and click on the square around the church to select this polygon. Click Confirm to start the demolition. The system will recalculate the models based on the changes made to the current situation. | |||
# Now it is possible to plant some trees on the open land. Select the public green action in the action menu bar. Notice now the [[Brush|drawing tool]] is set to the grid selection mode. Place your mouse in the [[3D Visualization]] and hold down your left mouse button. Now drag your mouse over the part of the map you want to select to plant new trees. Release the left mouse button when you have selected the entire square around the church. All green parts will be filled with new trees. Red areas are skipped during planting; therefore, it is not necessary to select only green areas. In the legend at the bottom of the interface an indication is given why some parts of the drawn selection are red. To place the trees, confirm your selection by clicking the Build button. | |||
# Select the PE Temperature overlay again and view the timeframes by clicking the play button. Notice the difference in the heat stress results in this future situation in comparison with the current situation. To make a good comparison, the fourth timeframe shows a clear difference. Select the fourth timeframe by clicking the minus button next to the play button after the time frames are finished playing. | |||
# In the [[top bar]] of the [[Viewer]], select the "Original" setting in the top bar in the display section. This switches the overlay to the original situation, before trees were planted, where the square was still very hot. Select the "Planned" setting again, to display the result after your action of planting trees. | |||
# Switch to other overlays, and switch between "Original" and "Planned" settings to make the comparison for other overlays in the Heat Stress module. | |||
# Let's go back to the [[Green (Indicator)|Green indicator]] by clicking on it in the topbar. Notice the situation is improved now because of the action you have performed in this future scenario. The situation is changed from 68 m2 to 72 m2 (approximately, depending on the precise selections you made). | |||
# As final action activate the [[Measures|measure]] in the Tower action menu. Opening this action menu automatically directs you to a specific location in the project area. Here a new plan is already designed. By clicking "Apply" and then "Confirm", you can activate this plan and all results are immediately calculated and visualized. | |||
# To compare the before and after situation it is also possible to activate the [[Difference (Overlay)|Difference overlay]]. To do so, open the PE Temperature overlays and select the Difference overlay option. Notice the impact this tower and parkinglot has on its surroundings. | |||
<gallery mode=nolines> | |||
File:Zoom_in_on_map.jpg|1. Zoom in on this part of the map | |||
File:Maps_selection_and_action_menu_activated.jpg|2. Activate action menu | |||
File:Demolish2.jpg|3. Demolish | |||
File:Build_trees2.jpg|4. Build trees | |||
File:Result_future_situation.jpg|5. View results in future situations | |||
File:Result_current_situation.jpg|7. Compare the current and future situation | |||
File:Green_target_after_action.jpg|8. Compare the current and future situation | |||
File:Tower_and_parking_measure.jpg|9. Activate measure | |||
File:Difference_overlay_Demo_project.jpg|10. Difference overlay | |||
</gallery> | |||
{|class="wikitable" style="margin: auto; background-color:#ffffcc;" | {|class="wikitable" style="margin: auto; background-color:#ffffcc;" | ||
| [[Demo Heat Project|<<Previous page]] | | [[Demo Heat Stress Project|<<Previous page]] | ||
| [[Demo Heat FAQ | | [[Demo Heat FAQ|Next page>>]] | ||
|} | |} | ||
Latest revision as of 11:53, 13 July 2026
| <<Previous page | Next page>> |
Explore performing actions and future scenarios
- Perform an action to modify the current situation and visualize how adjustments can improve heat stress in the project area. For this action we zoom in on a part of the map just below the middle of the map, in the old city center. This is an area which gets very hot so let's improve this part of the town. The image below shows the location on the map.
- Switch back to the default map and select the FUTURE DESIGN tab. Notice the action menu bar appeared on the left side of the map. Make sure you see the square with the church in your project area.
- On the square around the church no trees are present yet. Trees reduce heat stress, so let's plant some trees. Before you can add some new trees on the square you need to demolish (a part of) the square. Select the demolish action in the action menu bar on the left side of the Viewer interface. Notice for the drawing drawing tool the polygon-pick mode is selected, and click on the square around the church to select this polygon. Click Confirm to start the demolition. The system will recalculate the models based on the changes made to the current situation.
- Now it is possible to plant some trees on the open land. Select the public green action in the action menu bar. Notice now the drawing tool is set to the grid selection mode. Place your mouse in the 3D Visualization and hold down your left mouse button. Now drag your mouse over the part of the map you want to select to plant new trees. Release the left mouse button when you have selected the entire square around the church. All green parts will be filled with new trees. Red areas are skipped during planting; therefore, it is not necessary to select only green areas. In the legend at the bottom of the interface an indication is given why some parts of the drawn selection are red. To place the trees, confirm your selection by clicking the Build button.
- Select the PE Temperature overlay again and view the timeframes by clicking the play button. Notice the difference in the heat stress results in this future situation in comparison with the current situation. To make a good comparison, the fourth timeframe shows a clear difference. Select the fourth timeframe by clicking the minus button next to the play button after the time frames are finished playing.
- In the top bar of the Viewer, select the "Original" setting in the top bar in the display section. This switches the overlay to the original situation, before trees were planted, where the square was still very hot. Select the "Planned" setting again, to display the result after your action of planting trees.
- Switch to other overlays, and switch between "Original" and "Planned" settings to make the comparison for other overlays in the Heat Stress module.
- Let's go back to the Green indicator by clicking on it in the topbar. Notice the situation is improved now because of the action you have performed in this future scenario. The situation is changed from 68 m2 to 72 m2 (approximately, depending on the precise selections you made).
- As final action activate the measure in the Tower action menu. Opening this action menu automatically directs you to a specific location in the project area. Here a new plan is already designed. By clicking "Apply" and then "Confirm", you can activate this plan and all results are immediately calculated and visualized.
- To compare the before and after situation it is also possible to activate the Difference overlay. To do so, open the PE Temperature overlays and select the Difference overlay option. Notice the impact this tower and parkinglot has on its surroundings.
-
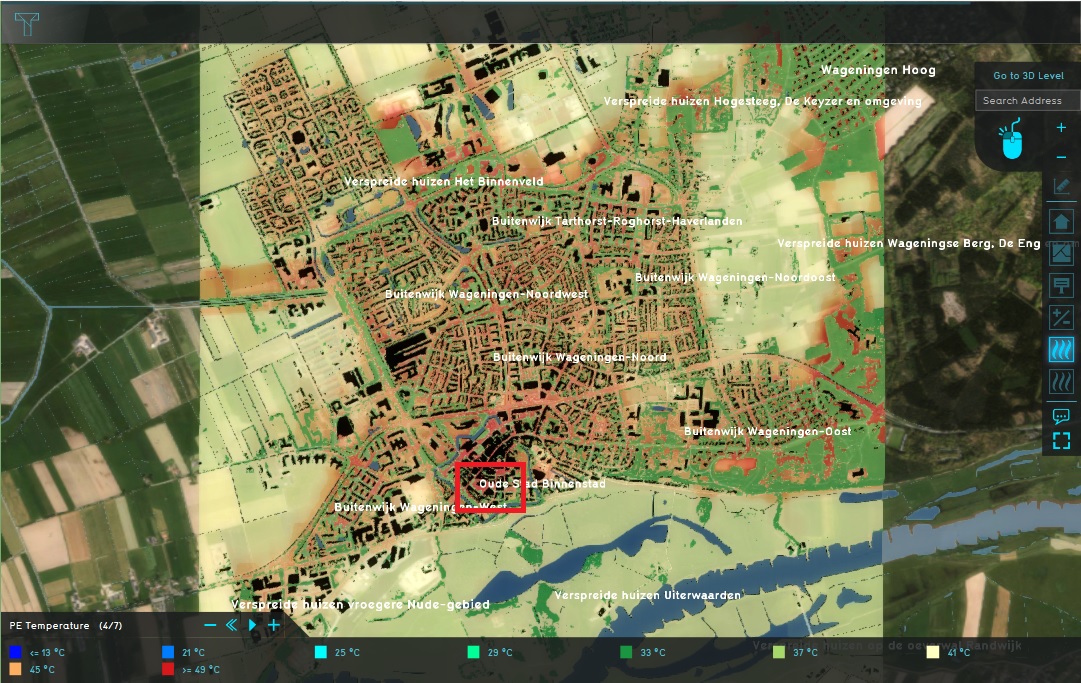 1. Zoom in on this part of the map
 -
 2. Activate action menu
 -
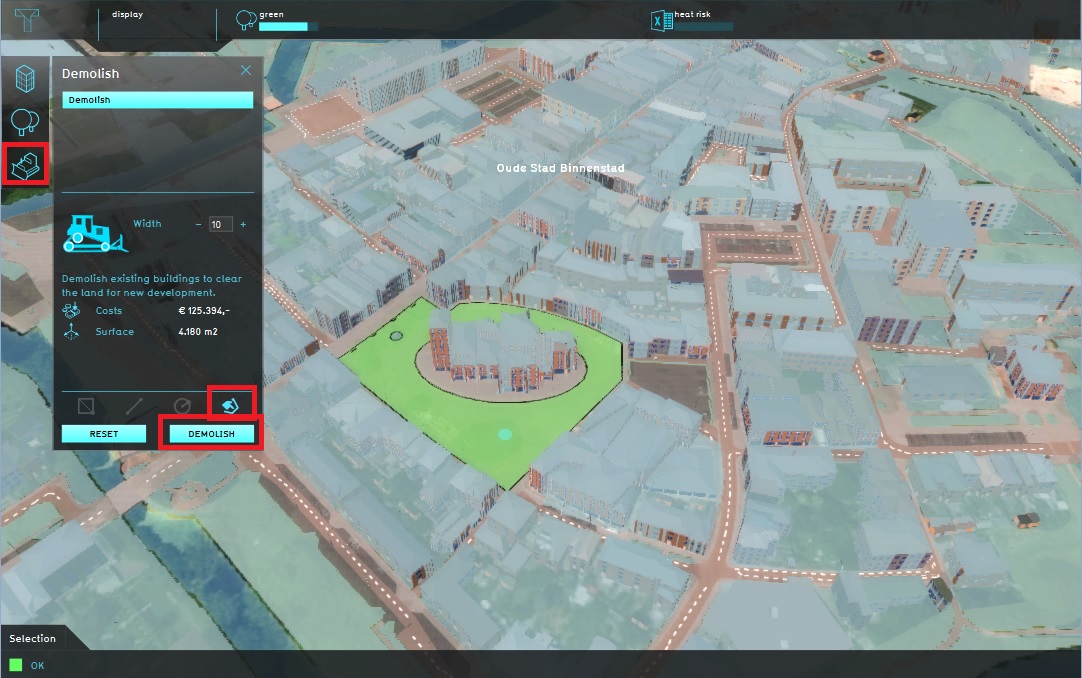 3. Demolish
 -
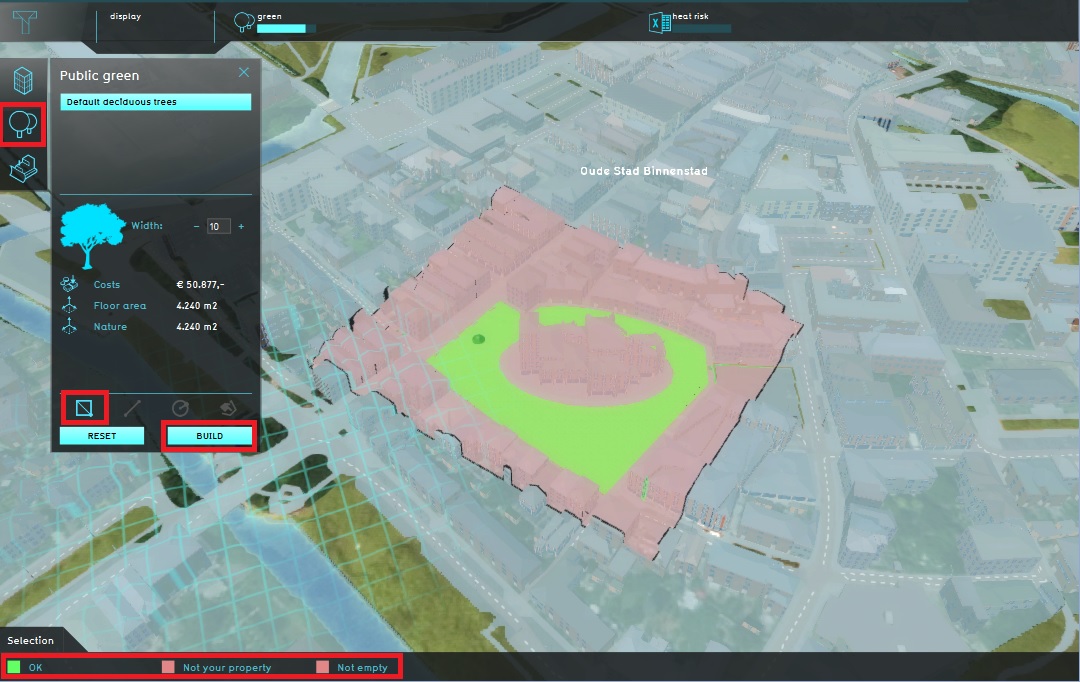 4. Build trees
 -
 5. View results in future situations
 -
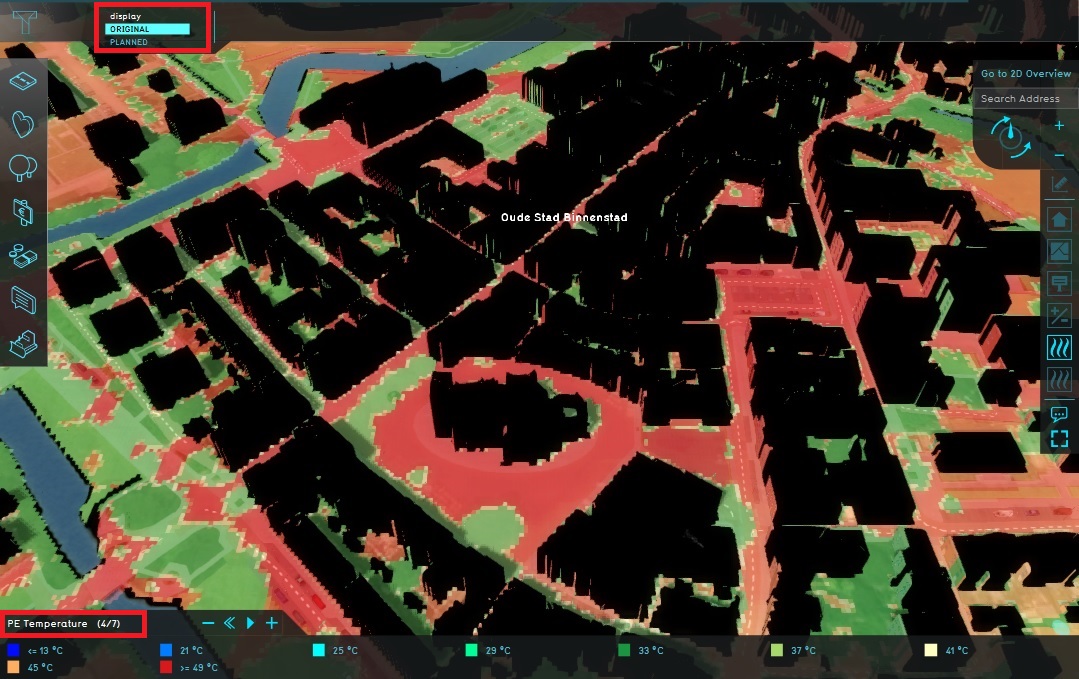 7. Compare the current and future situation
 -
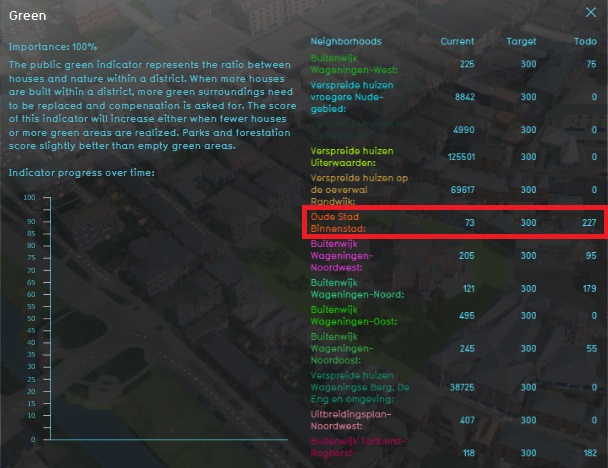 8. Compare the current and future situation
 -
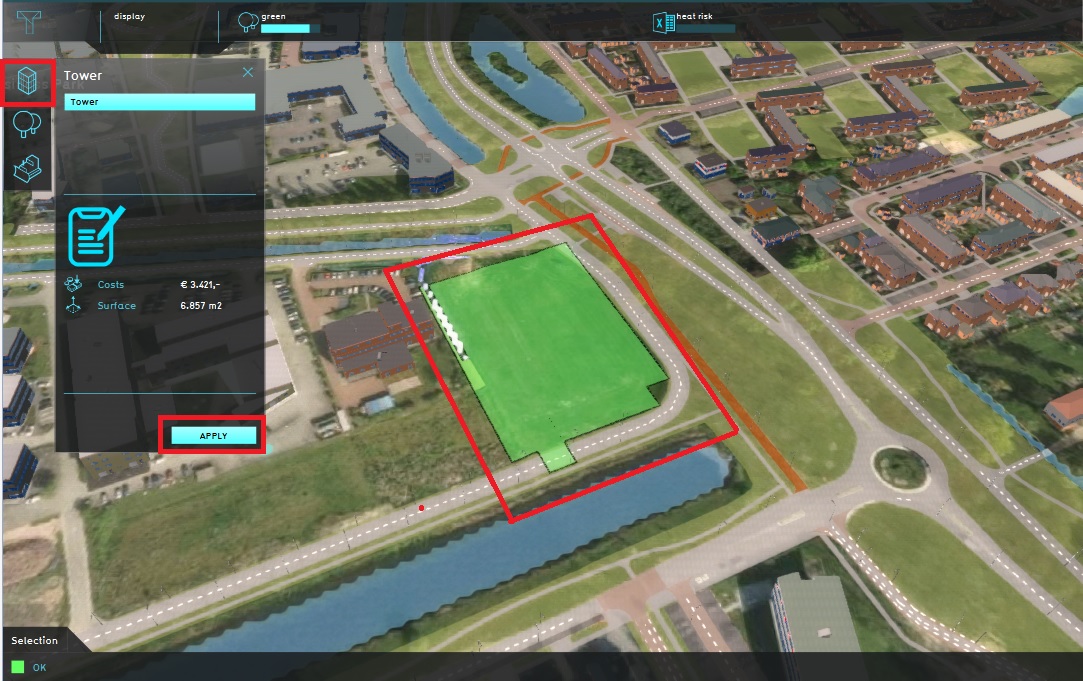 9. Activate measure
 -
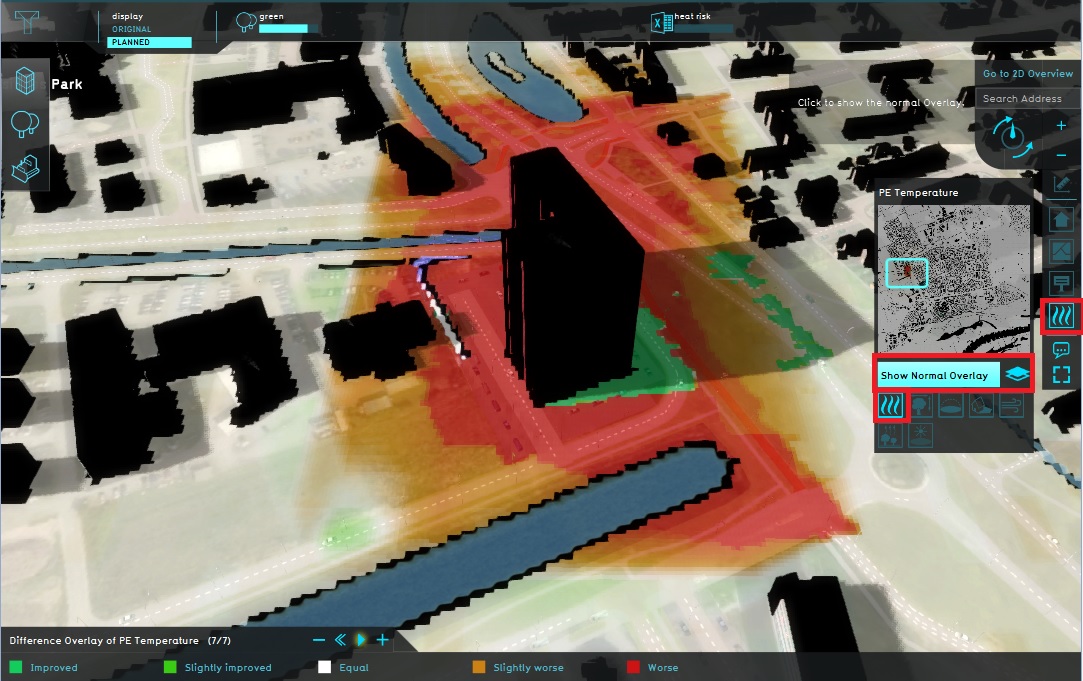 10. Difference overlay


| <<Previous page | Next page>> |