Web interface tutorial: Difference between revisions
m (→Custom panels) |
No edit summary |
||
| (94 intermediate revisions by 3 users not shown) | |||
| Line 1: | Line 1: | ||
{{tutorial prerequisites | {{tutorial prerequisites | ||
|tutorial=This tutorial relies on base knowledge about the editor interface, the creation of panels, and the ability to script in HTML, CSS, and JavaScript. | |tutorial=This tutorial relies on base knowledge about the editor interface, the creation of panels, and the ability to script in HTML, CSS, and JavaScript. | ||
|project=This tutorial can be followed with any project of any arbitrary location. Note that the tutorial will involve adding and removing overlays and default indicators. | |project=This tutorial can be followed with any project of any arbitrary location. Note that the tutorial will involve adding and removing overlays and default indicators. | ||
|required-excel=true | |||
|required-IDE=HTML, CSS, JavaScript | |required-IDE=HTML, CSS, JavaScript | ||
|required-IDE-example=Notepad is sufficient | |required-IDE-example=Notepad is sufficient | ||
|additional=For the assets section, a .png file is required. | |||
|Start your project. This can be a pre-existing project, or a newly created project. | |Start your project. This can be a pre-existing project, or a newly created project. | ||
|Start your preferred IDE. It will be required in the later stages of the tutorial. | |Start your preferred IDE. It will be required in the middle stages of the tutorial. | ||
|Start Excel. It will be required in the middle and later stages of the tutorial. | |||
}} | }} | ||
==Introduction to the Web interface== | ==Introduction to the Web interface== | ||
The [[web interface]] is a web-based interface with which a [[project]] in the | The [[web interface]] is a web-based interface with which a [[project]] in the {{software}} can be presented. It is a web page, built up using HTML, CSS, and JavaScript, generated and served by the {{software}}. By default, data presented by the web interface includes the a 2D map visualization of the [[project]], [[indicator]]s present in the project, and the available [[overlay]]s. Each [[stakeholder]] in a project has their own unique web interface available, similar to how they have their own perspectives in the [[{{software|client}}]].{{page_break}} | ||
==Accessing the Web interface (from the editor)== | ==Accessing the Web interface (from the editor)== | ||
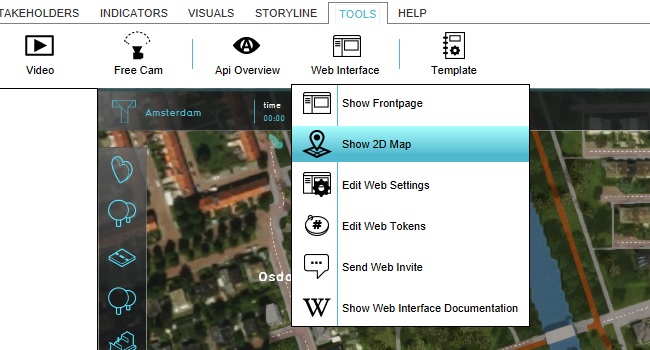
To access the Web interface from the editor, go to: | To access the Web interface from the editor, go to: | ||
{{Editor | {{Editor location|web interface map}} | ||
[[File:WebInterface-editor-dropdown-2Dmap.jpg|350px|frame|center|Opening the web interface.]] | [[File:WebInterface-editor-dropdown-2Dmap.jpg|350px|frame|center|Opening the web interface.]] | ||
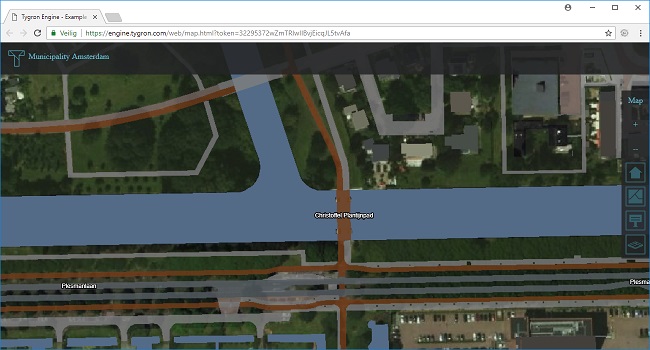
This will open the default browser on your computer, directed at the link {{url|link=1|protocol=1|append=/web/map.html?token=TOKEN}} (in which "TOKEN" is replaced with a proper authentication token.) The web interface opened will be the web interface for the stakeholder currently selected in the editor. | This will open the default browser on your computer, directed at the link {{url|link=1|protocol=1|append=/web/map.html?token=TOKEN}} (in which "TOKEN" is replaced with a proper authentication token.) The web interface opened will be the web interface for the stakeholder currently selected in the editor. | ||
[[File:WebInterface-display-2Dmap-opened.jpg|350px|frame|center|The web interface in Google Chrome.]] | [[File:WebInterface-display-2Dmap-opened.jpg|350px|frame|center|The web interface in Google Chrome.]]{{page_break}} | ||
===Web interface compared to the | ===Web interface compared to the {{software|client}}=== | ||
The first thing you will notice is that the web interface offers no editing tools. It is a parallel for the | The first thing you will notice is that the web interface offers no editing tools. It is a parallel for the [[viewer ]]interface only, meaning that end-users will only be able to interact with the session they are currently in. The web interface is not used for editing project data in the same manner as the editor. | ||
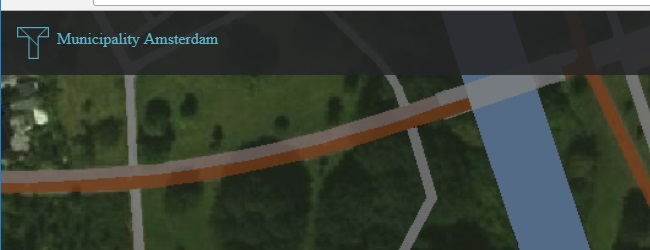
The second thing is that the web interface matches the | The second thing is that the web interface matches the [[viewer ]]interface in some areas. There is a top bar which displays the name of the current stakeholder, and the individual indicators in the project which are visible to the stakeholder. (In the example image, no indicators are present in the project yet, so no indicators are present in the web interface either). | ||
[[File:WebInterface-display-2Dmap-opened-topbar.jpg|350px|frame|center|The web interface top bar.]] | [[File:WebInterface-display-2Dmap-opened-topbar.jpg|350px|frame|center|The web interface top bar.]] | ||
| Line 27: | Line 29: | ||
[[File:WebInterface-display-2Dmap-opened-overlays.jpg|350px|frame|center|The web interface overlays menu.]] | [[File:WebInterface-display-2Dmap-opened-overlays.jpg|350px|frame|center|The web interface overlays menu.]] | ||
The third thing is that the web interface does not feature any [[ | The third thing is that the web interface does not feature any [[Action Menu]]s. For interactions based on the Action Menus, such as drawing locations for new [[building]]s or performing [[terrain]] alterations, the {{software|client}} is required.{{page_break}} | ||
===Changes in (project) data=== | ===Changes in (project) data=== | ||
The | The interface in the {{software|client}} is made to respond to most changes in the project data or in the running session, but explicitly not all changes. A rule of thumb is that data which may change during a proper [[session]] are updated, but data which is defined at editing-time and unchanging for the duration of a session or testrun do not. This is illustrated as follows. | ||
In the editor, edit the stakeholder you have currently selected: | In the editor, edit the [[stakeholder]] you have currently selected: | ||
{{Editor | {{Editor location|stakeholders|Your current Stakeholder}} | ||
Edit both the (full) Name and the Short name of the stakeholder. | Edit both the (full) Name and the Short name of the stakeholder. | ||
[[File:WebInterface-editor-stakeholder-name.jpg|350px|frame|center|Changing the name of the current stakeholder in the editor.]] | [[File:WebInterface-editor-stakeholder-name.jpg|350px|frame|center|Changing the name of the current stakeholder in the editor.]] | ||
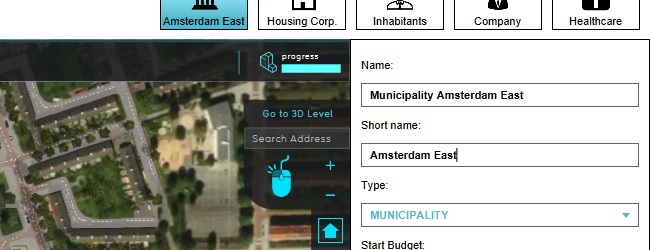
Notice that in the | Notice that in the {{software|client}}, the name of the stakeholder is updated. But that in the Web interface, the name is unchanged. This is because although readily changed in the editor, during a session the name of a stakeholder never changes. | ||
[[File:WebInterface-display-stakeholder-name.jpg|350px|frame|center|The difference in stakeholder name. Left: the name in the 3D interface is changed. Right: the name in the | [[File:WebInterface-display-stakeholder-name.jpg|350px|frame|center|The difference in stakeholder name. Left: the name in the 3D interface is changed. Right: the name in the web interface is unchanged.]] | ||
Refreshing the page will cause the name in the web interface to be updated. | Refreshing the page will cause the name in the web interface to be updated. | ||
| Line 51: | Line 53: | ||
[[File:WebInterface-display-overlaypanel-overlay.jpg|350px|frame|center|The overlay is not immediately visible in the web interface.]] | [[File:WebInterface-display-overlaypanel-overlay.jpg|350px|frame|center|The overlay is not immediately visible in the web interface.]] | ||
Refresh the web interface again to update the list of overlays. | Refresh the web interface again to update the list of overlays.{{page_break}} | ||
===Changes in session data=== | ===Changes in session data=== | ||
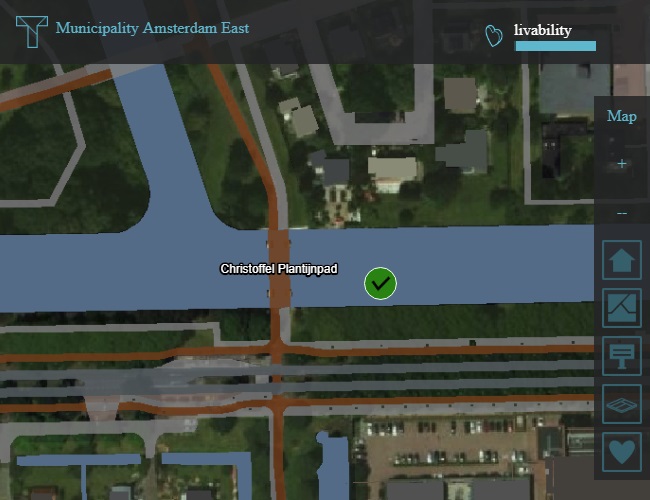
Make sure the project has a livability indicator, a livability overlay and a text [[panel]] with a popup in the 3D | Make sure the project has a livability indicator, a livability overlay and a text [[panel]] with a popup in the [[3D Visualization]]. | ||
[[File:WebInterface-display-2Dmap-setup.jpg|350px|frame|center|The web interface setup for this section.]] | [[File:WebInterface-display-2Dmap-setup.jpg|350px|frame|center|The web interface setup for this section.]] | ||
| Line 71: | Line 73: | ||
Notice that the change does not automatically propagate to the panel contents. However, when you click on the popup again, the panel contents will be refreshed and you will see the change you have made. Close the panel. | Notice that the change does not automatically propagate to the panel contents. However, when you click on the popup again, the panel contents will be refreshed and you will see the change you have made. Close the panel. | ||
Select the livability overlay in the web interface. You will see the livability overlay appear in the web interface, in the same manner as you would expect in the | Select the livability overlay in the web interface. You will see the livability overlay appear in the web interface, in the same manner as you would expect in the {{software|client}}. | ||
[[File:WebInterface-display-overlay.jpg|350px|frame|center|The livability overlay in the web interface.]] | [[File:WebInterface-display-overlay.jpg|350px|frame|center|The livability overlay in the web interface.]] | ||
| Line 79: | Line 81: | ||
[[File:WebInterface-display-overlay2.jpg|350px|frame|center|The purple-hued livability overlay in the web interface.]] | [[File:WebInterface-display-overlay2.jpg|350px|frame|center|The purple-hued livability overlay in the web interface.]] | ||
You will have noticed that the behavior between the panels and indicators, and the overlay, differs. The difference in behavior stems from the fact that data of the panels and the indicators are retrieved only once, when they are requested. At that time, the | You will have noticed that the behavior between the panels and indicators, and the overlay, differs. The difference in behavior stems from the fact that data of the panels and the indicators are retrieved only once, when they are requested. At that time, the {{software}} will provide the web interface with the most recent determined content. Neither the {{software}}, nor the web interface, track whether the contents have changed in such a way that an update is required. This tracking does occur with the overlay. In principle, only when the end-user select an overlay is the relevant data retrieved from the {{software}}. However, the web interface is notified when new overlay information is available. If the overlay is opened, the newest data is automatically retrieved. | ||
Remove the livability indicator, the livability overlay, and the text panel. | Remove the livability indicator, the livability overlay, and the text panel.{{page_break}} | ||
==Web settings== | ==Web settings== | ||
It's possible to configure the web interface with a number of settings, allowing for complex modifications of its appearance and behavior. To access the web settings, go to: | It's possible to configure the web interface with a number of settings, allowing for complex modifications of its appearance and behavior. To access the web settings, go to: | ||
{{Editor | {{Editor location|web settings}} | ||
[[File:WebInterface-editor-websettings.jpg|350px|frame|center|The web settings for the web interface.]] | [[File:WebInterface-editor-websettings.jpg|350px|frame|center|The web settings for the web interface.]] | ||
Generally, each change in web settings will only affect a web interface when the web interface is refreshed. | Generally, each change in web settings will only affect a web interface when the web interface is refreshed.{{page_break}} | ||
===Base map=== | |||
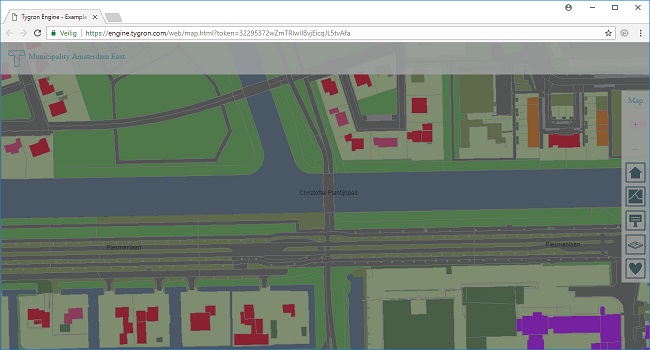
The base map can be changed. By default, this is a satellite map of the project area. However, alternative options allow for other base maps. The topographic map, for instance, is more stylized, and offers more explicit contrast between building types and terrain heights. | The base map can be changed. By default, this is a satellite map of the project area. However, alternative options allow for other base maps. The topographic map, for instance, is more stylized, and offers more explicit contrast between building types and terrain heights. | ||
[[File:WebInterface-map-topographic.jpg|350px|frame|center|The topographic map option in the web interface.]] | [[File:WebInterface-map-topographic.jpg|350px|frame|center|The topographic map option in the web interface.]] | ||
Change the base map setting and refresh the web interface. | Change the base map setting and refresh the web interface.{{page_break}} | ||
==CSS== | ==CSS== | ||
| Line 116: | Line 114: | ||
By adding the above line to the CSS, the styling of the entire web application has been modified. Specifically, every element of the interface of the class "ui" now has a white, slightly transparent background, as opposed to the slightly transparent black background color it was by default. | By adding the above line to the CSS, the styling of the entire web application has been modified. Specifically, every element of the interface of the class "ui" now has a white, slightly transparent background, as opposed to the slightly transparent black background color it was by default. | ||
If is important to note that while this styling has changed the web interface's appearance, the | If is important to note that while this styling has changed the web interface's appearance, the interface in the {{software|client}} is unchanged.{{page_break}} | ||
Add the following lines to the end of the CSS file: | Add the following lines to the end of the CSS file: | ||
| Line 130: | Line 128: | ||
[[File:WebInterface-css3.jpg|350px|frame|center|The changed styling in the web interface.]] | [[File:WebInterface-css3.jpg|350px|frame|center|The changed styling in the web interface.]] | ||
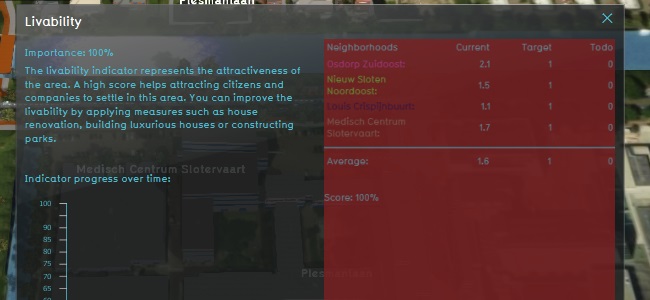
Add an indicator to the project, and open the indicator in the | Add an indicator to the project, and open the indicator in the [[viewer ]]interface in the {{software|client}}. You will see that the explanation section of the indicator will now have a red background, and is half-transparent. | ||
[[File:WebInterface-css4.jpg|350px|frame|center|The changed styling of an indicator in the | [[File:WebInterface-css4.jpg|350px|frame|center|The changed styling of an indicator in the {{software|client}}.]] | ||
This demonstrates an important fact, namely that interface elements such as indicators and panels, which can have their contents defined as HTML, are actually also just web pages, the styling of which matches the styling of the web interface. The uploaded CSS file affects those contents too. However, the "regular" interface elements in the | This demonstrates an important fact, namely that interface elements such as indicators and panels, which can have their contents defined as HTML, are actually also just web pages, the styling of which matches the styling of the web interface. The uploaded CSS file affects those contents too. However, the "regular" interface elements in the {{software|client}} are unaffected. | ||
Remove the added lines from the CSS file and upload it again to restore the default styling. | Remove the added lines from the CSS file and upload it again to restore the default styling.{{page_break}} | ||
==Custom panels== | ==Custom panels== | ||
The web settings offer facility to add an additional panel to the web interface. Naively, this allows you to add a (constantly visible) panel to the web interface, which can provide a user with additional and/or constantly visible information, and one or more options to interact with the | The web settings offer facility to add an additional panel to the web interface. Naively, this allows you to add a (constantly visible) panel to the web interface, which can provide a user with additional and/or constantly visible information, and one or more options to interact with the [[project]]. However, such a panel can also house a more fully developed web application, complete with Javascript interaction and complex styling. | ||
Add a text panel to the project. Set the title of the text panel to "My first panel" and the contents of the panel to: | Add a text panel to the project. Set the title of the text panel to "My first panel" and the contents of the panel to: | ||
| Line 146: | Line 144: | ||
In the web settings panel, make sure the "Custom Panel" option is checked, and that the dropdown of Custom Panel is set to "My first panel". This will cause the panel to be added to the web interface. | In the web settings panel, make sure the "Custom Panel" option is checked, and that the dropdown of Custom Panel is set to "My first panel". This will cause the panel to be added to the web interface. | ||
[[File:WebInterface-websettings-custompanel.jpg|350px|frame|center|The web setting for the Custom Panel is set.]] | |||
However, when you refresh the web interface, you will not see the panel yet. This is because the panel is added to a part of the web interface which is hidden by default. This is to prevent an empty element from unintentionally becoming visible when no panel is set to fill it with. To make the panel visible, we can add a styling rule to the panel to make the relevant element visible. The element has both the id and class "custom", and is styled by its class with "display:none". Change the contents of the panel to: | However, when you refresh the web interface, you will not see the panel yet. This is because the panel is added to a part of the web interface which is hidden by default. This is to prevent an empty element from unintentionally becoming visible when no panel is set to fill it with. To make the panel visible, we can add a styling rule to the panel to make the relevant element visible. The element has both the id and class "custom", and is styled by its class with "display:none". Change the contents of the panel to: | ||
| Line 159: | Line 158: | ||
} | } | ||
</style>}} | </style>}} | ||
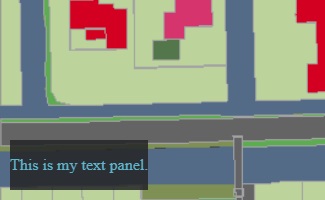
You will immediately see the text panel appear in the bottom left of the web interface. By adding the styling rule which explicitly makes the panel visible and positions it relative to the viewport, the contents of the panel are made apparent. | You will immediately see the text panel appear in the bottom left of the web interface. By adding the styling rule which explicitly makes the panel visible and positions it relative to the viewport, the contents of the panel are made apparent. | ||
[[File:WebInterface-panel1.jpg|350px|frame|center|The panel as made visible in the web interface.]]{{page_break}} | |||
===Automatic updating of the custom panel=== | ===Automatic updating of the custom panel=== | ||
It is important to note that the web interface has displayed the panel without having to refresh the interface. The custom panel is explicitly updated whenever the | It is important to note that the web interface has displayed the panel without having to refresh the interface. The custom panel is explicitly updated whenever the {{software}} processes an update of data. The contents of the panel specified in the web settings are injected into the "custom" html element, overwriting any previous contents. | ||
During this injection process, any javascript defined in the panel is run as well. Change the contents of the panel to: | During this injection process, any javascript defined in the panel is run as well. Change the contents of the panel to: | ||
{{code|<p> | {{code|1=<p> | ||
This is my text panel. | This is my text panel. | ||
</p> | </p> | ||
| Line 180: | Line 179: | ||
display: block; | display: block; | ||
position: fixed; | position: fixed; | ||
bottom: | bottom: 60px; | ||
left: 10px; | left: 10px; | ||
} | } | ||
| Line 186: | Line 185: | ||
<script> | <script> | ||
if ($('.customCounter').length===0) { | if ($('.customCounter').length===0) { | ||
$('.custom'.parent().append($(' | $('.custom').parent().append($('<div class="ui customCounter">0</div>')); | ||
} | } | ||
$('.customCounter').html($('.customCounter').html()+1); | $('.customCounter').html( parseInt($('.customCounter').html()) +1); | ||
</script> | </script> | ||
}} | }} | ||
The panel will immediately update in the web interface. The directly visible contents have not changed, but the added bit of JavaScript code has added a second html element to the page, outside of the custom element. In this element, a number is visible. The code will increase the number in this panel by 1, every time the code is run. And the code is run, every time an update of data in the {{software}} takes place, because that will cause the code to be injected into the custom html element anew. | |||
Change the title of the panel a few times and notice the counter counting up. | |||
[[File:WebInterface-panel2.jpg|350px|frame|center|The panel now has a counter above it. Every data update, the counter will increase by 1.]] | |||
The above example demonstrates that it's possible to inject HTML, CSS styling, and JavaScript code into the web interface, and to affect the interface outside of the panel itself. Additionally, it is possible to keep interface element available in a persistent manner, even while the html element is updated. Using these means, it is possible to alter the interface entirely, to better fit your use-case.{{page_break}} | |||
{{header|level=3|color=#c45911|Assignments}} | |||
These assignments explore basic techniques made possible by Custom Panels. | |||
# Create a new text panel and set it as custom panel in the web settings | |||
# Modify the text panel to hide the top bar | |||
# Replace the text panel with an excel panel which does the same | |||
# Modify the excel panel to display the number of houses in the project using TQL. | |||
# Modify the excel panel to display the names of all stakeholder, and the amount of houses they own, with the current stakeholder highlighted. (Hint: this requires JavaScript.) | |||
Remove the panels created in these assignments when you are done. | |||
{{page_break}} | |||
==Front Page== | |||
In a similar vein to the custom panel, it is possible to set a "Front page". This is a panel which can be displayed instead of the full interface we have been using up to this point, before entering that interface. | |||
Create a text panel with the name "My frontpage panel", and the following contents: | |||
{{code|1=<p> | |||
Welcome to my project. | |||
</p> | |||
}} | |||
In the Web Settings, ensure the "Front Page Panel" checkbox is checked, and select "My frontpage panel" from the related dropdown. | |||
[[File:WebInterface-websettings-frontpagepanel.jpg|350px|frame|center|The web setting for the Front Page Panel is set.]] | |||
To open the frontpage from the editor, go to: | |||
{{Editor location|web interface frontpage}} | |||
[[File:WebInterface-editor-dropdown-frontpage.jpg|350px|frame|center|Opening the Frontpage.]]{{page_break}} | |||
You will now be presented with a mostly empty page, containing the text "Welcome to my project." The title of the page is the title of the panel: "My frontpage panel". | |||
[[File:WebInterface-display-frontpage1.jpg|350px|frame|center|The Frontpage.]] | |||
Nothing except the contents of the panel are displayed. Here, a user can be presented with any message. Commonly, this is used to introduce the user to the project, and will include some sort of means to continue to the interface with the map we have seen so far. | |||
Change the contents of the panel to: | |||
{{code|1=<p> | |||
Welcome to my project. | |||
</p> | |||
<a href="map.html?token=$TOKEN">Click here to continue</a> | |||
}} | |||
The added line is a typical HTML link to a different page. The {{software}} automatically replaces the "$TOKEN" section by the required {{inlink|Web Tokens|authentication}} token. | |||
Refresh the web page with the frontpage. There is now a link which can be clicked to continue to the 2D Map. | |||
[[File:WebInterface-display-frontpage2.jpg|350px|frame|center|The Frontpage with a link to the 2D map.]] | |||
It's helpful to summarize here the following facts: | |||
* The web address for the front page is {{url|link=1|protocol=1|append=/web/?token=TOKEN}} | |||
* The web address for the 2D map is {{url|link=1|protocol=1|append=/web/map.html?token=TOKEN}} | |||
* In the editor, the option "Show Front Page" shows the frontpage. | |||
* In the editor, the option "Show 2D Map" shows the 2D map. | |||
* When there is no front page defined, the web address for the frontpage shows the same content as the web address for the 2D map.{{page_break}} | |||
==Assets== | |||
The {{software}} allows you to upload your own .png assets for use in the {{software}}. | |||
[[File:WebInterface-editor-websettings-image.jpg|350px|frame|center|The Image URL section of the web settings.]] | |||
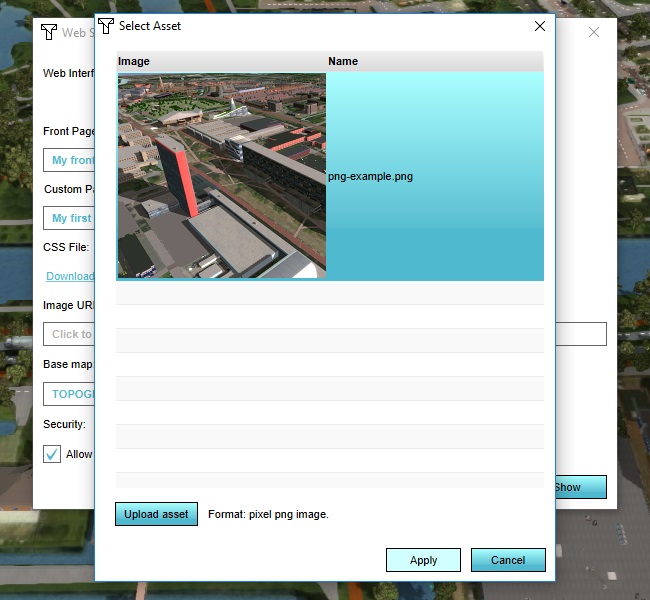
To upload an asset, click on the "Click to show image URL" field. This will show the assets list. | |||
[[File:WebInterface-editor-websettings-image-emptyselect.jpg|350px|frame|center|The as of yet empty asset selection list.]]{{page_break}} | |||
(If you do not yet have a PNG file ready, download the below image by right-clicking it, and selecting "Save as...") | |||
[[File:Campus-png.png|350px|frame|center|An example PNG image which can be used for this section of the tutorial.]] | |||
Select "Upload Asset", select a PNG file to upload to your project, and it will be added to the assets list. | |||
[[File:WebInterface-editor-websettings-image-uploadedasset.jpg|350px|frame|center|The asset selection list with a selected asset.]]{{page_break}} | |||
Select the uploaded asset, and select "Apply". | |||
[[File:WebInterface-editor-websettings-image-uploadedasset-selected.jpg|350px|frame|center|The asset selected.]] | |||
The URL with which the image can be accessed is now listed in the Image URL field of the web settings panel. | |||
[[File:WebInterface-editor-websettings-image-selected.jpg|350px|frame|center|The relative URL of the image.]] | |||
Select "Show in Browser" to show the image in the browser. This will show the image in the browser, and the full address to access the asset. If you want to download the image from the {{software}}, you can now right-click the image and download it. | |||
In the editor, change the contents of the (text) panel currently set as frontpage to: | |||
{{code|1=<p> | |||
Welcome to my project. | |||
</p> | |||
<div> | |||
<img src="assets/png-example.png?token=$TOKEN"> | |||
</div> | |||
<a href="map.html?token=$TOKEN">Click here to continue</a> | |||
}} | |||
The above html is based on "assets/png-example.png?token=$TOKEN" being the asset's relative URL as presented in the web settings panel. Replace "assets/png-example.png?token=$TOKEN" with the URL presented in the web settings panel if your asset's URL is different.{{page_break}} | |||
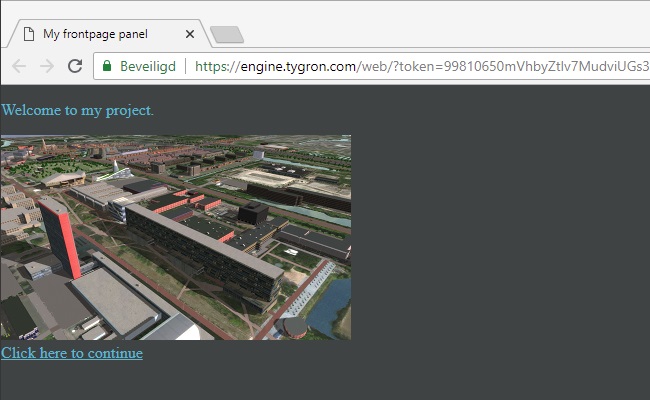
Reopen or refresh the frontpage in the browser. You will see the image you uploaded in the frontpage now. | |||
[[File:WebInterface-display-frontpage3.jpg|350px|frame|center|The frontpage now features the uploaded image.]]{{page_break}} | |||
==Web tokens== | |||
In the urls for the web interface (both for the Frontpage as well as the 2D map), a query parameter named "token" is present, with an alphanumeric character string. This is the [[Web_interface#Authentication|authentication token]]. Authentication for the web interface occurs via these tokens. These tokens are composed of 2 parts: the session token and the stakeholder's web token. The session token is equal to the session id, and is unique for each concurrently running session. The webtoken is a property of a stakeholder. Because the web token is part of the authentication token, and is linked to a stakeholder, the authentication token not only serves to identify which session is requested, but also inherently which stakeholder perspective. | |||
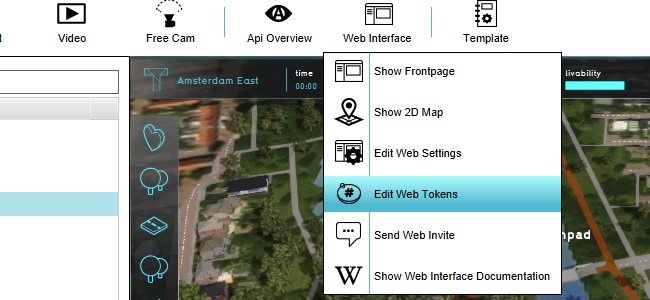
Using these web tokens directly is not recommended, as authentication is already handled by the {{software}}. However, it may sometimes be necessary to (re)generate the web tokens in a project. To modify the web tokens currently linked to the stakeholders, go to: | |||
{{Editor location|Web Tokens}} | |||
[[File:WebInterface-editor-dropdown-webtokens.jpg|350px|frame|center|Opening the panel for editing Web Tokens.]] | |||
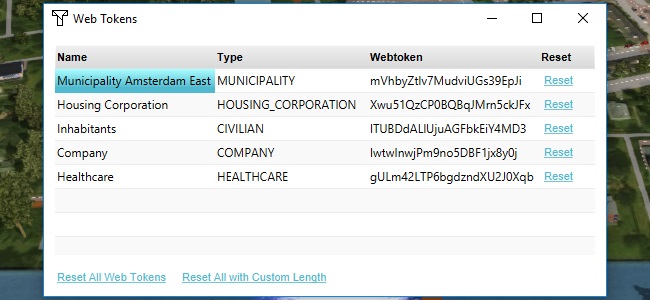
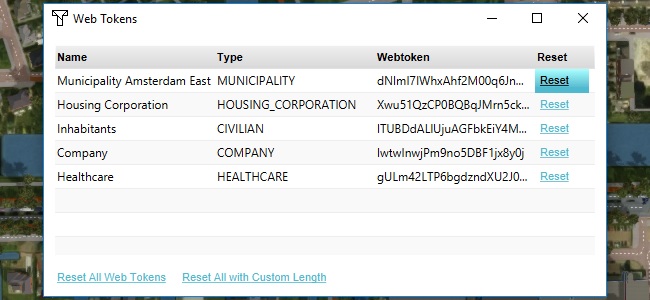
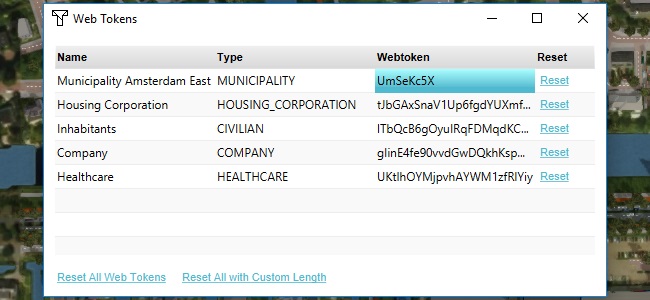
This opens the Web Tokens panel. | |||
[[File:WebInterface-editor-webtokens.jpg|350px|frame|center|The Web Tokens panel.]]{{page_break}} | |||
For your currently selected stakeholder, select "Reset". | |||
[[File:WebInterface-editor-webtokens-reset.jpg|350px|frame|center|Resetting the web token of a specific stakeholder.]] | |||
Refresh the web interface. You will no longer see the web interface. Instead, you now get an error indicating that your (web)token is invalid. Reopen the web interface(s) via the editor to regain access. You will notice that new addresses for the web interface feature the token now generated for your stakeholder in the list of web tokens. | |||
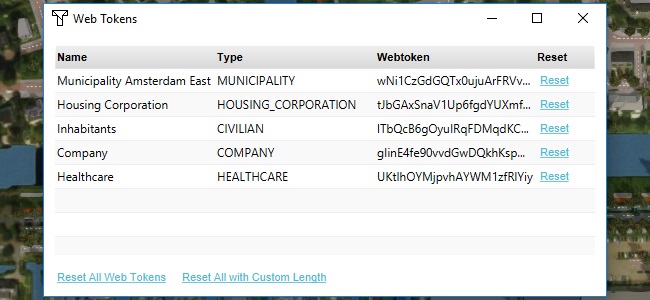
To reset the webtokens for all stakeholders at once, select "Reset All Web Tokens". | |||
[[File:WebInterface-editor-webtokens-resetall.jpg|350px|frame|center|Resetting the web tokens of all stakeholders.]]{{page_break}} | |||
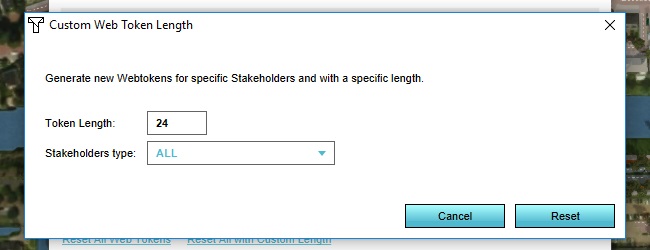
It may also be desirable to reduce the length of the web tokens generated. Select "Reset All with Custom Length". You will be prompted to set the desired length (at least 6, at most 24), and the stakeholder type for which to effect this reset. | |||
[[File:WebInterface-editor-webtokens-resetcustom.jpg|350px|frame|center|Resetting the web tokens to a custom length.]] | |||
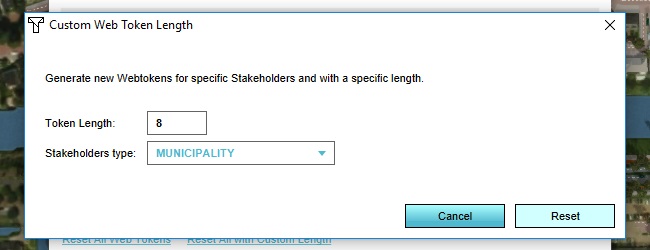
Set the Token Length to 8, the Stakeholder type to "MUNICIPALITY", and select "Reset". | |||
[[File:WebInterface-editor-webtokens-resetcustom-changed.jpg|350px|frame|center|The changed settings for the reset of web tokens, including adjusted length.]] | |||
The web tokens for all municipal stakeholder (of which most projects only have 1 or maybe 2) will have been reset, and will only be 8 characters long. | |||
[[File:WebInterface-editor-webtokens-municipal8.jpg|350px|frame|center|The municipal stakeholders' web tokens have been reset, and the new token is only 8 characters long.]] | |||
Again, to access the web interface, reopen it from the editor. Take note that the web interface still uses an authentication token of the same length, but that the web token is padded with zeroes. Any authentication token which does not meet the required length is invalid. | |||
[[File:WebInterface-display-address-webtoken8.jpg|350px|frame|center|The web interface address with a shortened web token.]] | |||
It's helpful to summarize here the following facts: | |||
* If you reset a web token (either for an individual stakeholder or all stakeholders) the length of the new web token is the same as the length of the old web token. | |||
* If you duplicate a stakeholder, the duplicate will have the same token as the original. If multiple stakeholders have the same web token, only one of their perspectives is accessible. Reset the web token of the duplicate (or the original) to correct this. | |||
* If you use your project as a template to create a new project, the stakeholders in your new project which are carried over from the template will have the same web tokens as the stakeholders in the template. Depending on your use-case, this may be desirable, or undesirable. Reset the web tokens as appropriate. | |||
* If you wish to use the token in your panels for any reason, use "$TOKEN". This will automatically be replaced with the proper token.{{page_break}} | |||
==Security and access== | |||
The web interface technology restricts access to the data of your project. It is easy to imagine the web interface has access to the full [[API]], but by design it does not. | |||
Depending on the target demographic, users may be knowledgeable with the functioning and debugging of HTML and javascript. This is a security consideration. The web interface uses authentication tokens which differ from the API's authentication token for this reason. The tokens used for the web interface only have access to limited datasets via the web url. In general, only the following data is available in a limited fashion to the web interface, and where applicable only the elements which are available to the stakeholder: | |||
* [[popup]]s | |||
* [[indicator]]s | |||
* [[overlay]]s | |||
* [[panel]]s | |||
* [[net line]]s | |||
More information can be made available by using TQL to load information in a panel, but security should be considered when doing so. In general, any information which should not be available to a given stakeholder should not appear in the output of any panel which can be accessed by the stakeholder. This includes panels which have no assigned stakeholder (and thus are available to all stakeholders) and panels which are assigned to the stakeholder in question. | |||
Additionally, when concerned about security, you should assume that a technical end-user also knows the correct syntax for the execution of events. The web settings allow you to configure which events a user can or cannot fire. | |||
For the purposes of this example, make sure the "Allow Participant Events" and "Allow Logic Events" options are checked in the web settings. | |||
[[File:WebInterface-websettings-security.jpg|350px|frame|center|The security options of the web settings.]] | |||
Add the following lines to the output of the panel currently set as custom panel: | |||
{{code|1= | |||
<input type="submit" onclick="$.ajax({ | |||
url: '$SLOT/event/LogicEventType/NEIGHBORHOOD_SET_ATTRIBUTE/?token=$TOKEN', | |||
method: 'POST', | |||
data: {0:'0', 1:'COLOR', 2:'-16777216'} | |||
}).then(function(){showOverlay(activeOverlayID,true);});" value="Change neighborhood color">}} | |||
In the web interface, the custom panel will now have updated to feature a "Change neighborhood color" button. It will set the color of one of the neighborhoods to solid black.{{page_break}} | |||
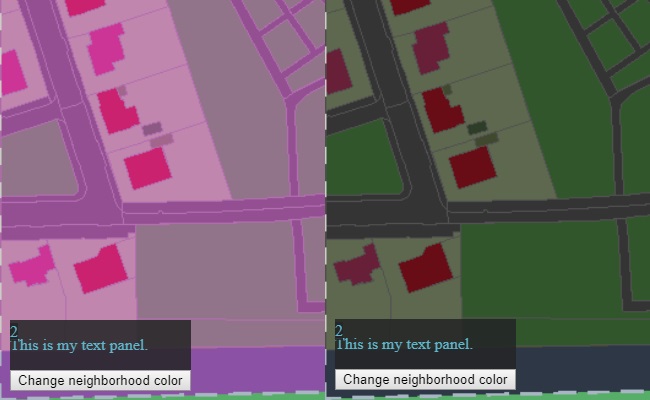
In the web interface, select the "Neighborhoods overlay". Then click "Change neighborhoods color". This will start a testrun. The color of one of the neighborhoods will change, because of the event attached to the button. (You may need to switch to another overlay and back before seeing the difference.) | |||
[[File:WebInterface-display-overlay3.jpg|350px|frame|center|The color of the overlay in the web interface before and after clicking the button.]] | |||
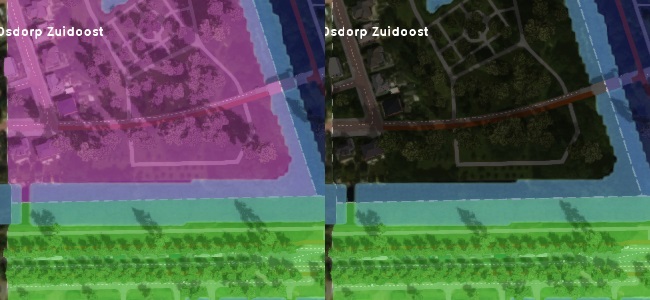
The difference in overlay color will also be visible in the editor, when you select the neighborhoods overlay there. | |||
[[File:WebInterface-display-overlay4.jpg|350px|frame|center|The color of the overlay in the editor before and after clicking the button.]] | |||
It is important to note that the color of the neighborhood has now changed for all stakeholders. Switch to a different stakeholder, and select the neighborhoods overlay. You can see that the other stakeholder also sees a different color for the affected neighborhood. | |||
In this example, this change was effected by a button added to the web interface explicitly. However, a sufficiently savvy end-user may be able to perform the same action by crafting a similar request to the {{software}} even without the option being provided by the web interface.{{page_break}} | |||
Stop the current testrun. In the web settings panel, uncheck the "Allow Participant Events" and "Allow Logic Events" options. | |||
[[File:WebInterface-websettings-security-off.jpg|350px|frame|center|The security options of the web settings, disallowing events to be sent via the web interface.]] | |||
Refresh the web interface, and click "Change neighborhood color" again. Nothing happens now. The request being made is treated by the {{software}} as an invalid request, and no change is made in the session data. The overlay's color remains the same. | |||
{{Tutorial completed | |||
| learned=how to access and modify the web interface to provide the data and interaction fitting for your use-case | |||
}} | |||
[[Category:Interface]] | |||
Latest revision as of 09:53, 1 March 2023
Prerequisites
The following prerequisites should be met before starting this tutorial:
- This tutorial relies on base knowledge about the editor interface, the creation of panels, and the ability to script in HTML, CSS, and JavaScript. If you have not yet followed the tutorials related to those subjects please do so first.
- This tutorial can be followed with any project of any arbitrary location. Note that the tutorial will involve adding and removing overlays and default indicators.
- Microsoft Excel is required for completing this tutorial.
- You will need an IDE or environment in which to edit HTML, CSS, JavaScript. For example: Notepad is sufficient.
- For the assets section, a .png file is required.
Preparations
Take the following steps as preparation for following this tutorial:
- Start your project. This can be a pre-existing project, or a newly created project.
- Start your preferred IDE. It will be required in the middle stages of the tutorial.
- Start Excel. It will be required in the middle and later stages of the tutorial.
Introduction to the Web interface
The web interface is a web-based interface with which a project in the Tygron Platform can be presented. It is a web page, built up using HTML, CSS, and JavaScript, generated and served by the Tygron Platform. By default, data presented by the web interface includes the a 2D map visualization of the project, indicators present in the project, and the available overlays. Each stakeholder in a project has their own unique web interface available, similar to how they have their own perspectives in the Tygron Client.
Accessing the Web interface (from the editor)
To access the Web interface from the editor, go to:
This will open the default browser on your computer, directed at the link https://engine.tygron.com/web/map.html?token=TOKEN (in which "TOKEN" is replaced with a proper authentication token.) The web interface opened will be the web interface for the stakeholder currently selected in the editor.
Web interface compared to the Tygron Client
The first thing you will notice is that the web interface offers no editing tools. It is a parallel for the viewer interface only, meaning that end-users will only be able to interact with the session they are currently in. The web interface is not used for editing project data in the same manner as the editor.
The second thing is that the web interface matches the viewer interface in some areas. There is a top bar which displays the name of the current stakeholder, and the individual indicators in the project which are visible to the stakeholder. (In the example image, no indicators are present in the project yet, so no indicators are present in the web interface either).
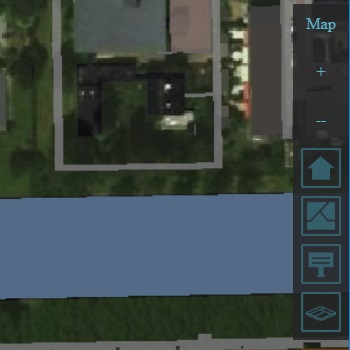
There is also a panel on the right of the screen, with familiar overlay buttons. These too are the overlays available to the currently selected stakeholder.
The third thing is that the web interface does not feature any Action Menus. For interactions based on the Action Menus, such as drawing locations for new buildings or performing terrain alterations, the Tygron Client is required.
Changes in (project) data
The interface in the Tygron Client is made to respond to most changes in the project data or in the running session, but explicitly not all changes. A rule of thumb is that data which may change during a proper session are updated, but data which is defined at editing-time and unchanging for the duration of a session or testrun do not. This is illustrated as follows.
In the editor, edit the stakeholder you have currently selected:
Edit both the (full) Name and the Short name of the stakeholder.
Notice that in the Tygron Client, the name of the stakeholder is updated. But that in the Web interface, the name is unchanged. This is because although readily changed in the editor, during a session the name of a stakeholder never changes.
Refreshing the page will cause the name in the web interface to be updated.
In the editor, add the livability indicator to your stakeholder. (If your stakeholder already has a livability indicator and overlay, remove the livability indicator and overlay from the project instead.)
Notice that in the web interface, the indicator you just added to the project is also immediately added to the web interface. (Or if you removed it, that it is removed.) During a session, an indicator may become available or unavailable to a stakeholder, so the web interface automatically updates to reflect this change.
However, the change in available overlays is not automatically reflected in the web interface, because the availability of overlays does not change during a proper session.
Refresh the web interface again to update the list of overlays.
Changes in session data
Make sure the project has a livability indicator, a livability overlay and a text panel with a popup in the 3D Visualization.
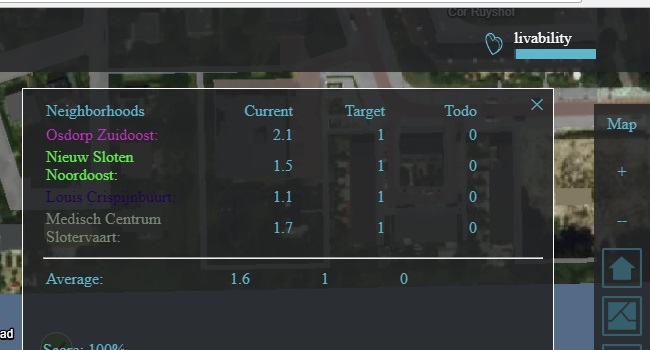
Click on the indicator entry to open it, similar to how you would in the session interface. You will see the indicator panel appear, in the same manner as you would expect in the session interface.
In the editor, effect a change in the indicator. For example: change the target, or the description of the indicator.
Notice that the change does not automatically propagate to the panel contents. However, when you click on the indicator again in the top bar, the panel contents will be refreshed and you will see the change you have made. Close the panel.
Click the text panel's popup in the web interface. A panel will appear with whatever content you have specified for it.
In the editor, change the text of the panel.
Notice that the change does not automatically propagate to the panel contents. However, when you click on the popup again, the panel contents will be refreshed and you will see the change you have made. Close the panel.
Select the livability overlay in the web interface. You will see the livability overlay appear in the web interface, in the same manner as you would expect in the Tygron Client.
In the editor, change the legend of the livability overlay so that every value is represented by a purple hue. (You can do this by going to Geo Data → Overlays → Livability Overlay, and selecting the "Legend" tab. There, select each color and change it to a purple color.) The colors do not need to be easy to interpret, they just need to be clearly different from the default colors.
You will see the overlay update immediately.
You will have noticed that the behavior between the panels and indicators, and the overlay, differs. The difference in behavior stems from the fact that data of the panels and the indicators are retrieved only once, when they are requested. At that time, the Tygron Platform will provide the web interface with the most recent determined content. Neither the Tygron Platform, nor the web interface, track whether the contents have changed in such a way that an update is required. This tracking does occur with the overlay. In principle, only when the end-user select an overlay is the relevant data retrieved from the Tygron Platform. However, the web interface is notified when new overlay information is available. If the overlay is opened, the newest data is automatically retrieved.
Remove the livability indicator, the livability overlay, and the text panel.
Web settings
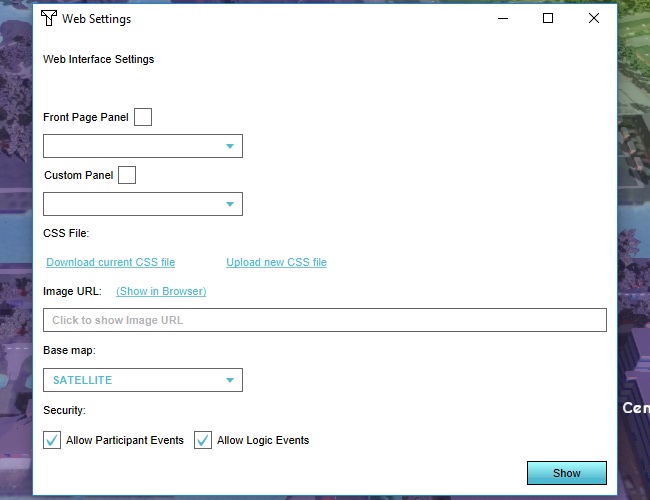
It's possible to configure the web interface with a number of settings, allowing for complex modifications of its appearance and behavior. To access the web settings, go to:
Generally, each change in web settings will only affect a web interface when the web interface is refreshed.
Base map
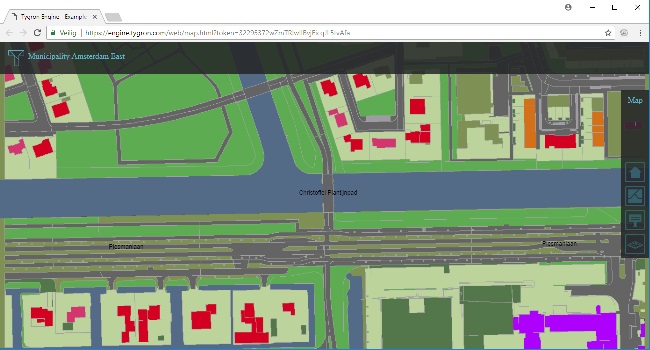
The base map can be changed. By default, this is a satellite map of the project area. However, alternative options allow for other base maps. The topographic map, for instance, is more stylized, and offers more explicit contrast between building types and terrain heights.
Change the base map setting and refresh the web interface.
CSS
Part of the web interface is the CSS file, which by default determines the styling of the entire web interface. This file can be downloaded, altered, and uploaded to change the styling of the web interface.
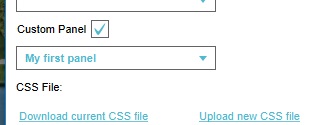
Select "Download current CSS file" to download the CSS file, and open it in your IDE of choice to edit it.
Add the following lines to the end of the CSS file:
.ui {
    background-color: rgba(255,255,255,0.85);
}
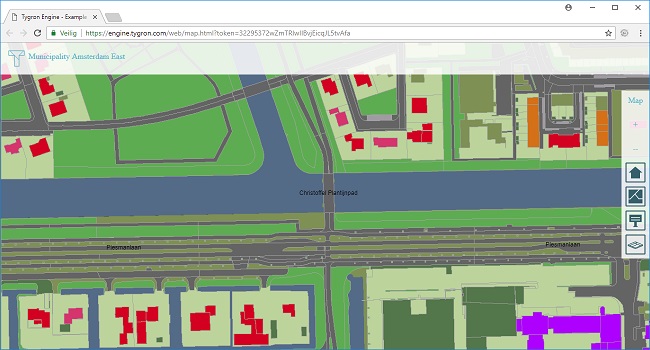
Save the file. Now select "Upload new CSS file", and select your modified CSS file. When the upload is complete, refresh the web interface to see the changes.
By adding the above line to the CSS, the styling of the entire web application has been modified. Specifically, every element of the interface of the class "ui" now has a white, slightly transparent background, as opposed to the slightly transparent black background color it was by default.
If is important to note that while this styling has changed the web interface's appearance, the interface in the Tygron Client is unchanged.
Add the following lines to the end of the CSS file:
body {
	background-color: rgba(128,32,32,0.8);
	opacity:0.5;
}
The above instructions create a red background on the entire webpage, and make the contents of the entire webpage half transparent.
Save and upload the file. Refresh the web interface, and you will see that the page is now half-transparent. You don't see the red background, because the web page is filled with other elements which together cover the entire page completely.
Add an indicator to the project, and open the indicator in the viewer interface in the Tygron Client. You will see that the explanation section of the indicator will now have a red background, and is half-transparent.
This demonstrates an important fact, namely that interface elements such as indicators and panels, which can have their contents defined as HTML, are actually also just web pages, the styling of which matches the styling of the web interface. The uploaded CSS file affects those contents too. However, the "regular" interface elements in the Tygron Client are unaffected.
Remove the added lines from the CSS file and upload it again to restore the default styling.
Custom panels
The web settings offer facility to add an additional panel to the web interface. Naively, this allows you to add a (constantly visible) panel to the web interface, which can provide a user with additional and/or constantly visible information, and one or more options to interact with the project. However, such a panel can also house a more fully developed web application, complete with Javascript interaction and complex styling.
Add a text panel to the project. Set the title of the text panel to "My first panel" and the contents of the panel to:
<p>
    This is my text panel.
</p>
In the web settings panel, make sure the "Custom Panel" option is checked, and that the dropdown of Custom Panel is set to "My first panel". This will cause the panel to be added to the web interface.
However, when you refresh the web interface, you will not see the panel yet. This is because the panel is added to a part of the web interface which is hidden by default. This is to prevent an empty element from unintentionally becoming visible when no panel is set to fill it with. To make the panel visible, we can add a styling rule to the panel to make the relevant element visible. The element has both the id and class "custom", and is styled by its class with "display:none". Change the contents of the panel to:
<p>
    This is my text panel.
</p>
<style>
    .custom {
        display: block;
        position: fixed;
        bottom: 10px;
        left: 10px;
    }
</style>
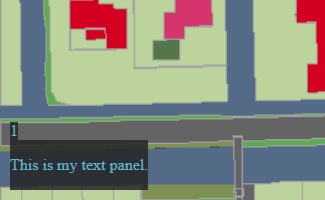
You will immediately see the text panel appear in the bottom left of the web interface. By adding the styling rule which explicitly makes the panel visible and positions it relative to the viewport, the contents of the panel are made apparent.
Automatic updating of the custom panel
It is important to note that the web interface has displayed the panel without having to refresh the interface. The custom panel is explicitly updated whenever the Tygron Platform processes an update of data. The contents of the panel specified in the web settings are injected into the "custom" html element, overwriting any previous contents.
During this injection process, any javascript defined in the panel is run as well. Change the contents of the panel to:
<p>
    This is my text panel.
</p>
<style>
    .custom {
        display: block;
        position: fixed;
        bottom: 10px;
        left: 10px;
    }
    .customCounter {
        display: block;
        position: fixed;
        bottom: 60px;
        left: 10px;
    }
</style>
<script>
    if ($('.customCounter').length===0) {
        $('.custom').parent().append($('<div class="ui customCounter">0</div>'));
    }
    $('.customCounter').html( parseInt($('.customCounter').html()) +1);
</script>
The panel will immediately update in the web interface. The directly visible contents have not changed, but the added bit of JavaScript code has added a second html element to the page, outside of the custom element. In this element, a number is visible. The code will increase the number in this panel by 1, every time the code is run. And the code is run, every time an update of data in the Tygron Platform takes place, because that will cause the code to be injected into the custom html element anew.
Change the title of the panel a few times and notice the counter counting up.
The above example demonstrates that it's possible to inject HTML, CSS styling, and JavaScript code into the web interface, and to affect the interface outside of the panel itself. Additionally, it is possible to keep interface element available in a persistent manner, even while the html element is updated. Using these means, it is possible to alter the interface entirely, to better fit your use-case.
Assignments
These assignments explore basic techniques made possible by Custom Panels.
- Create a new text panel and set it as custom panel in the web settings
- Modify the text panel to hide the top bar
- Replace the text panel with an excel panel which does the same
- Modify the excel panel to display the number of houses in the project using TQL.
- Modify the excel panel to display the names of all stakeholder, and the amount of houses they own, with the current stakeholder highlighted. (Hint: this requires JavaScript.)
Remove the panels created in these assignments when you are done.
Front Page
In a similar vein to the custom panel, it is possible to set a "Front page". This is a panel which can be displayed instead of the full interface we have been using up to this point, before entering that interface.
Create a text panel with the name "My frontpage panel", and the following contents:
<p>
    Welcome to my project.
</p>
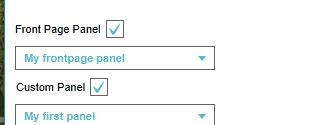
In the Web Settings, ensure the "Front Page Panel" checkbox is checked, and select "My frontpage panel" from the related dropdown.
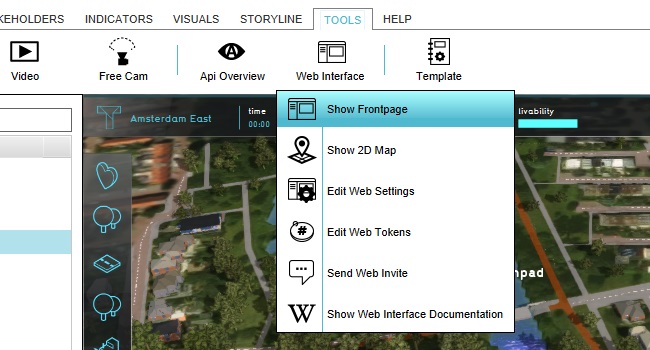
To open the frontpage from the editor, go to:
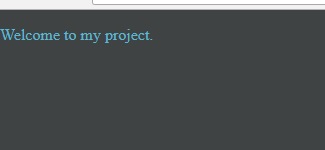
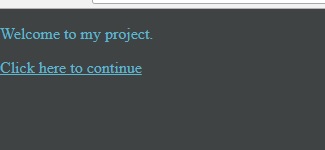
You will now be presented with a mostly empty page, containing the text "Welcome to my project." The title of the page is the title of the panel: "My frontpage panel".
Nothing except the contents of the panel are displayed. Here, a user can be presented with any message. Commonly, this is used to introduce the user to the project, and will include some sort of means to continue to the interface with the map we have seen so far.
Change the contents of the panel to:
<p>
    Welcome to my project.
</p>
<a href="map.html?token=$TOKEN">Click here to continue</a>
The added line is a typical HTML link to a different page. The Tygron Platform automatically replaces the "$TOKEN" section by the required authentication token.
Refresh the web page with the frontpage. There is now a link which can be clicked to continue to the 2D Map.
It's helpful to summarize here the following facts:
- The web address for the front page is https://engine.tygron.com/web/?token=TOKEN
- The web address for the 2D map is https://engine.tygron.com/web/map.html?token=TOKEN
- In the editor, the option "Show Front Page" shows the frontpage.
- In the editor, the option "Show 2D Map" shows the 2D map.
- When there is no front page defined, the web address for the frontpage shows the same content as the web address for the 2D map.
Assets
The Tygron Platform allows you to upload your own .png assets for use in the Tygron Platform.
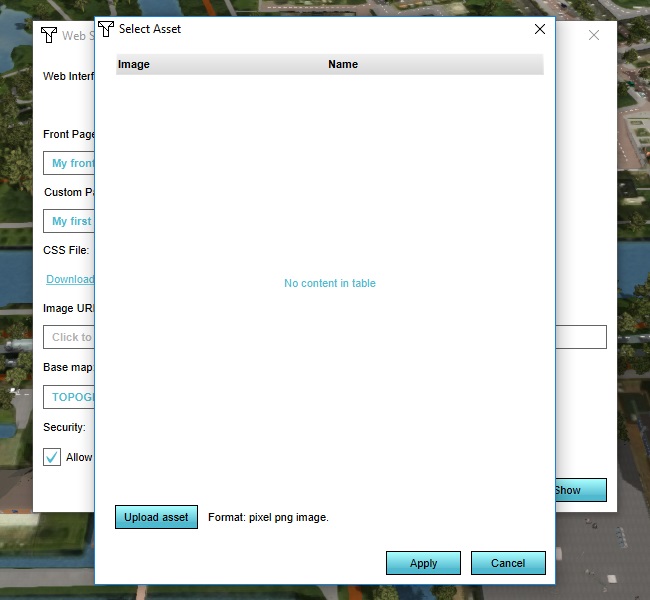
To upload an asset, click on the "Click to show image URL" field. This will show the assets list.
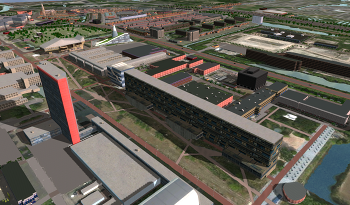
(If you do not yet have a PNG file ready, download the below image by right-clicking it, and selecting "Save as...")
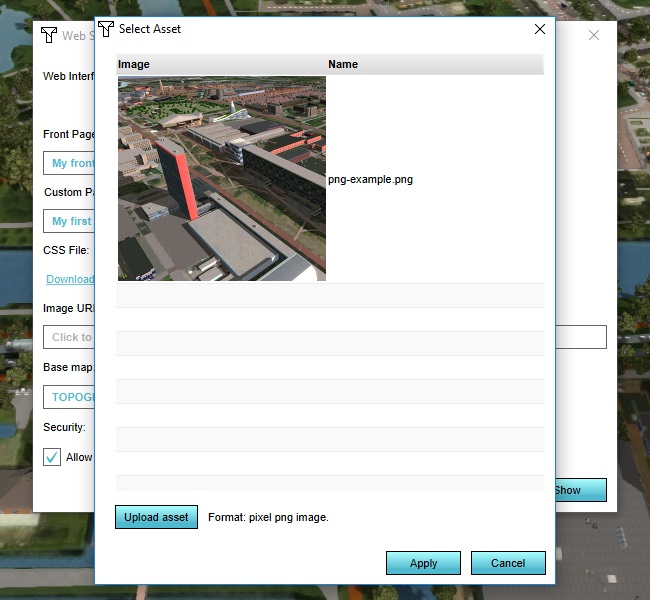
Select "Upload Asset", select a PNG file to upload to your project, and it will be added to the assets list.
Select the uploaded asset, and select "Apply".
The URL with which the image can be accessed is now listed in the Image URL field of the web settings panel.
Select "Show in Browser" to show the image in the browser. This will show the image in the browser, and the full address to access the asset. If you want to download the image from the Tygron Platform, you can now right-click the image and download it.
In the editor, change the contents of the (text) panel currently set as frontpage to:
<p>
    Welcome to my project.
</p>

<div>
    <img src="assets/png-example.png?token=$TOKEN">
</div>

<a href="map.html?token=$TOKEN">Click here to continue</a>
The above html is based on "assets/png-example.png?token=$TOKEN" being the asset's relative URL as presented in the web settings panel. Replace "assets/png-example.png?token=$TOKEN" with the URL presented in the web settings panel if your asset's URL is different.
Reopen or refresh the frontpage in the browser. You will see the image you uploaded in the frontpage now.
Web tokens
In the urls for the web interface (both for the Frontpage as well as the 2D map), a query parameter named "token" is present, with an alphanumeric character string. This is the authentication token. Authentication for the web interface occurs via these tokens. These tokens are composed of 2 parts: the session token and the stakeholder's web token. The session token is equal to the session id, and is unique for each concurrently running session. The webtoken is a property of a stakeholder. Because the web token is part of the authentication token, and is linked to a stakeholder, the authentication token not only serves to identify which session is requested, but also inherently which stakeholder perspective.
Using these web tokens directly is not recommended, as authentication is already handled by the Tygron Platform. However, it may sometimes be necessary to (re)generate the web tokens in a project. To modify the web tokens currently linked to the stakeholders, go to:
This opens the Web Tokens panel.
For your currently selected stakeholder, select "Reset".
Refresh the web interface. You will no longer see the web interface. Instead, you now get an error indicating that your (web)token is invalid. Reopen the web interface(s) via the editor to regain access. You will notice that new addresses for the web interface feature the token now generated for your stakeholder in the list of web tokens.
To reset the webtokens for all stakeholders at once, select "Reset All Web Tokens".
It may also be desirable to reduce the length of the web tokens generated. Select "Reset All with Custom Length". You will be prompted to set the desired length (at least 6, at most 24), and the stakeholder type for which to effect this reset.
Set the Token Length to 8, the Stakeholder type to "MUNICIPALITY", and select "Reset".
The web tokens for all municipal stakeholder (of which most projects only have 1 or maybe 2) will have been reset, and will only be 8 characters long.
Again, to access the web interface, reopen it from the editor. Take note that the web interface still uses an authentication token of the same length, but that the web token is padded with zeroes. Any authentication token which does not meet the required length is invalid.
It's helpful to summarize here the following facts:
- If you reset a web token (either for an individual stakeholder or all stakeholders) the length of the new web token is the same as the length of the old web token.
- If you duplicate a stakeholder, the duplicate will have the same token as the original. If multiple stakeholders have the same web token, only one of their perspectives is accessible. Reset the web token of the duplicate (or the original) to correct this.
- If you use your project as a template to create a new project, the stakeholders in your new project which are carried over from the template will have the same web tokens as the stakeholders in the template. Depending on your use-case, this may be desirable, or undesirable. Reset the web tokens as appropriate.
- If you wish to use the token in your panels for any reason, use "$TOKEN". This will automatically be replaced with the proper token.
Security and access
The web interface technology restricts access to the data of your project. It is easy to imagine the web interface has access to the full API, but by design it does not.
Depending on the target demographic, users may be knowledgeable with the functioning and debugging of HTML and javascript. This is a security consideration. The web interface uses authentication tokens which differ from the API's authentication token for this reason. The tokens used for the web interface only have access to limited datasets via the web url. In general, only the following data is available in a limited fashion to the web interface, and where applicable only the elements which are available to the stakeholder:
More information can be made available by using TQL to load information in a panel, but security should be considered when doing so. In general, any information which should not be available to a given stakeholder should not appear in the output of any panel which can be accessed by the stakeholder. This includes panels which have no assigned stakeholder (and thus are available to all stakeholders) and panels which are assigned to the stakeholder in question.
Additionally, when concerned about security, you should assume that a technical end-user also knows the correct syntax for the execution of events. The web settings allow you to configure which events a user can or cannot fire.
For the purposes of this example, make sure the "Allow Participant Events" and "Allow Logic Events" options are checked in the web settings.
Add the following lines to the output of the panel currently set as custom panel:
<input type="submit" onclick="$.ajax({
	url: '$SLOT/event/LogicEventType/NEIGHBORHOOD_SET_ATTRIBUTE/?token=$TOKEN',
	method: 'POST',
	data: {0:'0', 1:'COLOR', 2:'-16777216'}
}).then(function(){showOverlay(activeOverlayID,true);});" value="Change neighborhood color">
In the web interface, the custom panel will now have updated to feature a "Change neighborhood color" button. It will set the color of one of the neighborhoods to solid black.
In the web interface, select the "Neighborhoods overlay". Then click "Change neighborhoods color". This will start a testrun. The color of one of the neighborhoods will change, because of the event attached to the button. (You may need to switch to another overlay and back before seeing the difference.)
The difference in overlay color will also be visible in the editor, when you select the neighborhoods overlay there.
It is important to note that the color of the neighborhood has now changed for all stakeholders. Switch to a different stakeholder, and select the neighborhoods overlay. You can see that the other stakeholder also sees a different color for the affected neighborhood.
In this example, this change was effected by a button added to the web interface explicitly. However, a sufficiently savvy end-user may be able to perform the same action by crafting a similar request to the Tygron Platform even without the option being provided by the web interface.
Stop the current testrun. In the web settings panel, uncheck the "Allow Participant Events" and "Allow Logic Events" options.
Refresh the web interface, and click "Change neighborhood color" again. Nothing happens now. The request being made is treated by the Tygron Platform as an invalid request, and no change is made in the session data. The overlay's color remains the same.
Tutorial completed
Congratulations. You have now completed this tutorial. In it, you have learned how to access and modify the web interface to provide the data and interaction fitting for your use-case.
