How to make a point measurement: Difference between revisions
Jump to navigation
Jump to search
No edit summary |
No edit summary |
||
| (4 intermediate revisions by the same user not shown) | |||
| Line 1: | Line 1: | ||
{{howto|title=|Select any [[Grid overlay]] in the overlay menu.|Select the measuring tool icon (signified by a ruler) in the overlay menu, located between the zoom buttons and the overlay icons.|Select the ''Point Measurement'' option (signified by a point) at the top of the measuring tool window.|Click on the location in the [[3D | {{howto|title=|Select any [[Grid overlay]] in the overlay menu.|Select the measuring tool icon (signified by a ruler) in the overlay menu, located between the zoom buttons and the overlay icons.|Select the ''Point Measurement'' option (signified by a point) at the top of the measuring tool window.|Click on the location in the [[3D Visualization]] where a measurement is desired.|The graph in the measuring tool window now displays the value at location.}} | ||
<gallery widths=400px heights=400px mode=nolines> | <gallery widths=400px heights=400px mode=nolines> | ||
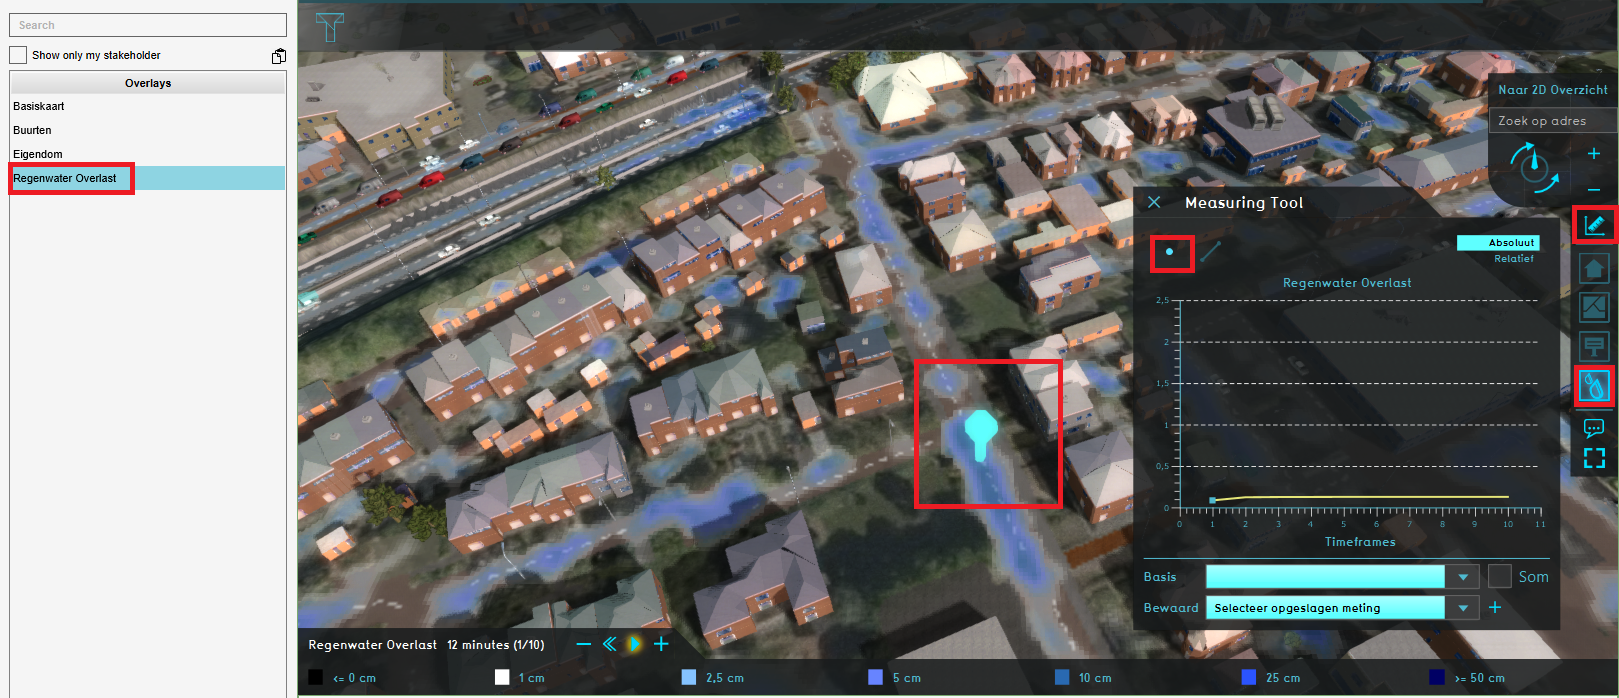
File:Point_measurement.PNG | File:Point_measurement.PNG|Making a point measurement in a Rainfall overlay's grid. | ||
</gallery> | </gallery> | ||
| Line 12: | Line 12: | ||
* [[Measuring tool]] | * [[Measuring tool]] | ||
* [[Measurement]] | * [[Measurement]] | ||
|howtos= | |||
* [[How to inspect object output attributes of an overlay using the measurement tool]] | * [[How to inspect object output attributes of an overlay using the measurement tool]] | ||
}} | }} | ||
[[Category:How-to's]] | |||
Latest revision as of 15:35, 30 January 2024
How to make a point measurement:
- Select any Grid overlay in the overlay menu.
- Select the measuring tool icon (signified by a ruler) in the overlay menu, located between the zoom buttons and the overlay icons.
- Select the Point Measurement option (signified by a point) at the top of the measuring tool window.
- Click on the location in the 3D Visualization where a measurement is desired.
- The graph in the measuring tool window now displays the value at location.
Notes
- If it's a Grid overlay with timeframe functionality, such as the Water, Heatstress and Subsidence Overlay, the graph displays the value at that location over time.
- In case a Water Overlay is selected and a visualized water object is selected for the location, an object measurement will be created instead of a point measurement.
