Traffic health impact (Indicator): Difference between revisions
No edit summary |
|||
| Line 25: | Line 25: | ||
{{Editor steps|title=add the traffic noise overlay|Select in the editor 'Current situation' from the ribbon|Hover over 'Overlays' in the ribbon bar|Select the traffic noise overlay from the drop down menu.}} | {{Editor steps|title=add the traffic noise overlay|Select in the editor 'Current situation' from the ribbon|Hover over 'Overlays' in the ribbon bar|Select the traffic noise overlay from the drop down menu.}} | ||
{{Editor steps|title=add the traffic NO2 overlay|Select in the editor 'Current situation' from the ribbon|Hover over 'Overlays' in the ribbon bar|Select the traffic NO2 overlay from the drop down menu.}} | {{Editor steps|title=add the traffic NO2 overlay|Select in the editor 'Current situation' from the ribbon|Hover over 'Overlays' in the ribbon bar|Select the traffic NO2 overlay from the drop down menu.}} | ||
{{Indicator nav}} | |||
[[Category:Index]] | [[Category:Index]] | ||
Revision as of 08:57, 26 January 2023
The traffic health impact indicator provides a combined output for the built-in calculated overlays for traffic noise emissions and traffic NO2 emissions. It calculates an absolute score based on the percentage of housing units suffering from either form of disturbance. This indicator can be used in project which deal with:
- health and livability considerations
- development of housing solutions
- traffic flow adjustments
This Excel indicator can be downloaded from the Tygron Index. Read on to find out more about the indicator's calculation method and how to set it up in your project.
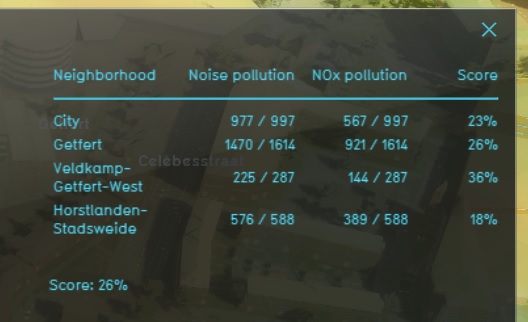
Indicator panel
The indicator panel shows the following information:
- The name of the neighborhood
- The amount of houses (related to the total amount of houses) which have more than 50.3 dB of noise.
- The amount of houses (related to the total amount of houses) which have more than 1 ug/m3 of NO2 impact.
- The score per neighborhood
Calculation
The indicator counts the total amount of housing units, and the amount of housing units that are affected by either noise or NO2 disturbance from traffic.
Score
The score of the indicator is the average of the percentage of houses not affected by noise pollution and the percentage of houses not affected by NO2 pollution. Both metric are counted with equal weight.
Additional configurations
The indicator requires the inclusion of both the traffic noise overlay and the traffic NO2 overlay.
- Select in the editor 'Current situation' from the ribbon
- Hover over 'Overlays' in the ribbon bar
- Select the traffic noise overlay from the drop down menu.
- Select in the editor 'Current situation' from the ribbon
- Hover over 'Overlays' in the ribbon bar
- Select the traffic NO2 overlay from the drop down menu.

