UK Benchmark 6 (Water Module): Difference between revisions
Jump to navigation
Jump to search
No edit summary |
No edit summary |
||
| (8 intermediate revisions by 2 users not shown) | |||
| Line 1: | Line 1: | ||
{{ | This [[Water Module benchmarks|benchmark]] performs ''UK EA benchmark Test 6 – Dambreak'' using the [[Water Module]] of the {{software}}. | ||
<youtube>2UO1UdOEbtU</youtube> | |||
This dambreak test case (see Appendix A.6 for details) is the original benchmark test case available from the IMPACT project (Soares-Frazão and Zech 2002), for which measurements from a physical model at the Civil Engineering Laboratory of the Université Catholique de Louvain (UCL) are available. | |||
Characteristics: | Characteristics: | ||
| Line 13: | Line 13: | ||
[[File:Inundation benchmark 07.PNG|600px]] | [[File:Inundation benchmark 07.PNG|600px]] | ||
==== | ====Results==== | ||
Measured water levels and velocities were provided by UCL for six points (G1 to G6, | |||
except for velocities at G6). Below the result for each point. | |||
[[File:Inundation benchmark 08.PNG]] | [[File:Inundation benchmark 08.PNG]] | ||
| Line 26: | Line 27: | ||
[[Category:Benchmarks]] | [[Category:Benchmarks]] | ||
{{Water Module buttons}} | |||
Latest revision as of 15:28, 5 March 2024
This benchmark performs UK EA benchmark Test 6 – Dambreak using the Water Module of the Tygron Platform.
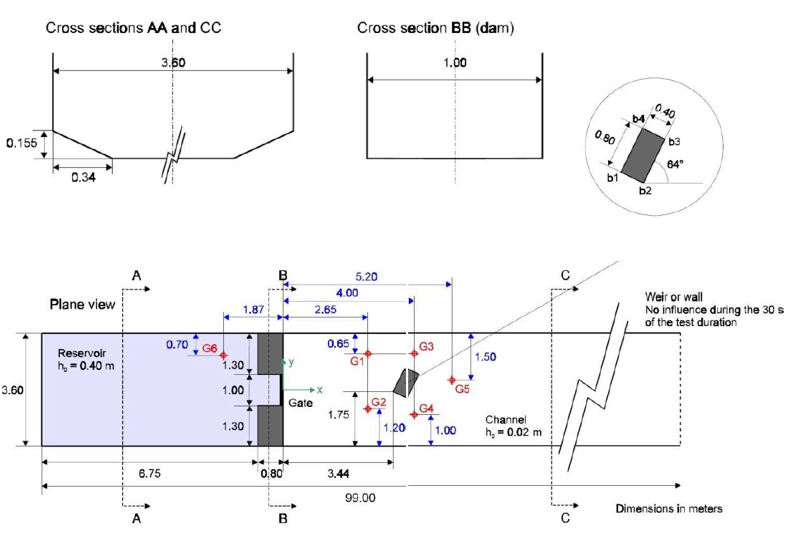
This dambreak test case (see Appendix A.6 for details) is the original benchmark test case available from the IMPACT project (Soares-Frazão and Zech 2002), for which measurements from a physical model at the Civil Engineering Laboratory of the Université Catholique de Louvain (UCL) are available.
Characteristics:
- Dimensions: 20X the values below
- Roughness: uniform manning = 0,05 m/s1/3
- Initiële conditions: 8m in reservoir, 0,4m in floodplain
- Modelgrid resolution: 2m
Results
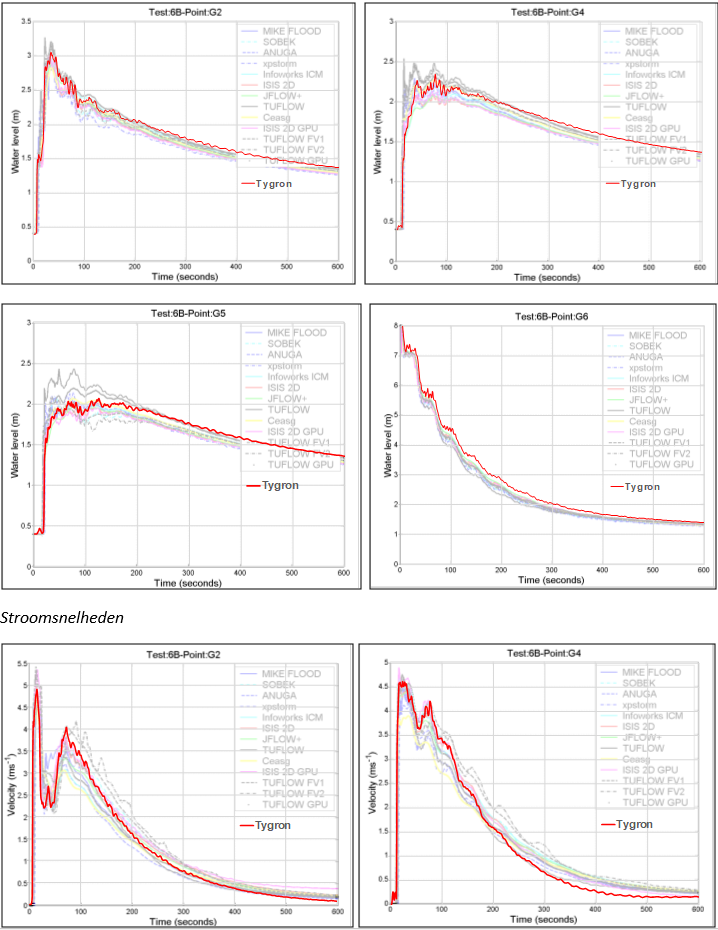
Measured water levels and velocities were provided by UCL for six points (G1 to G6, except for velocities at G6). Below the result for each point.
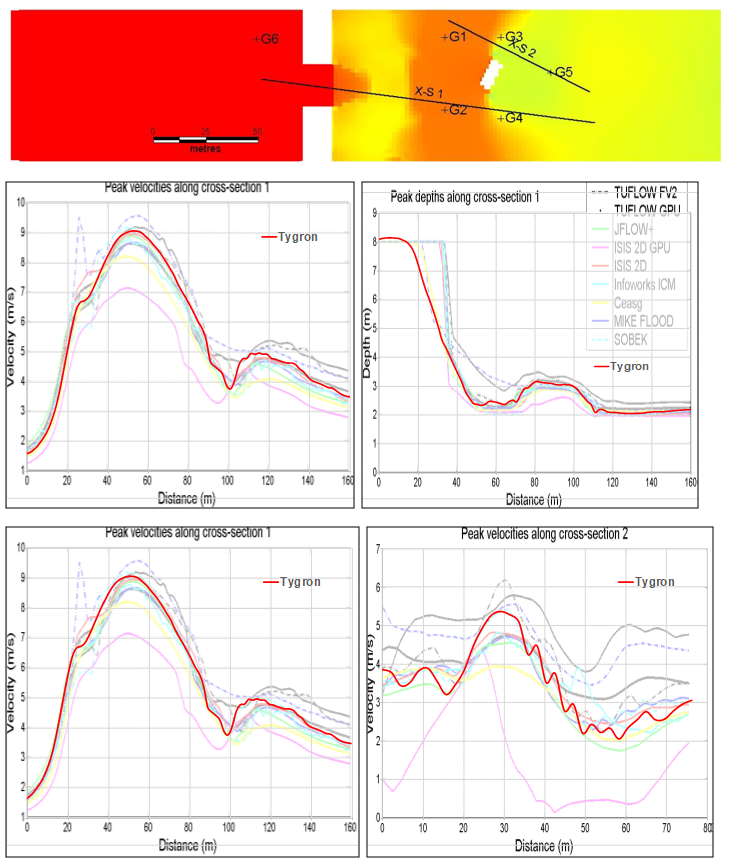
Velocity profiles
References
- Environmetal Agency (2013). Benchmarking the latest generation of 2D hydraulic modelling packages ∙ report Report – SC120002 ∙ found at: https://consult.environment-agency.gov.uk/engagement/bostonbarriertwao/results/appendix-6---neelz--s.---pender--g.--2013--benchmarking-the-latest-generation-of-2d-hydraulic-modelling-packages.-bristol_environment-agency.pdf (last visited 2018-08-03)


