Rainfall Overlay: Difference between revisions
| Line 118: | Line 118: | ||
===Infiltration=== | ===Infiltration=== | ||
Water stored on the surface, not added to sewer, building storage or evaporated can infiltrate in the subsoil. A cells infiltration capacity is assumed by: | Water stored on the surface, not added to sewer, building storage or evaporated can infiltrate in the subsoil. A cells infiltration capacity is assumed by: | ||
I = min(Ib,Isurf,Kv) | |||
'''I = min(Ib,Isurf,Kv)''' | |||
where: | where: | ||
* I is a cells infiltration capacity (m/day) | * I is a cells infiltration capacity (m/day) | ||
Revision as of 09:31, 20 June 2018
What is the Rainfall overlay?
The rainfall overlay is an Overlay displaying the hazard and impact of heavy rainfall over the project area. Based on the elevation model, terrain roughness and representations of the sewer and water systems, several result types can be displayed.
Adding and removing
To add a rainfall overlay go to the Overlays menu in the GEO DATA ribbon and select Add Rainfall. To remove the overlay, press Remove below the overlays list.


A Rainfall Overlay Tutorial is available to start working with this overlay.
Result types
The rainfall overlay is a grid overlay showing results of heavy rainfall on the surface (flooding), sub-surface (groundwater), open water and sewer system. The following results are produced:
| Result-Type | Unit | Descritpion |
|---|---|---|
| BASE_GROUNDWATER_DISTANCE | m (below surface) | Initial groundwater level relative to the surface level (NL: ontwateringsdiepte). |
| BASE_TYPES | nominal value | Division of gridcells in water, land or sewer areas that are connected to the sewer. |
| EVAPORATED | m (mm)¹ | Total evaporation over the simulation period |
| IMPACTED_BUILDINGS | nominal value | Constructions impacted by flood: the value from the function value indicator is assigned to a building if the water depth at a grid-cell surrounding the building exceeds the overlay attribute value IMPACT_FLOOD_TRESHOLD_M |
| SEWER_LAST_VALUE | m (mm)¹ | The amount of water in the sewer storage at the end of simulation |
| SEWER_MAX_VALUE | m (mm)¹ | Maximum amount of water in the sewer storage during the simulation |
| SURFACE_DURATION | s (min)¹ | The amount of time the water depth in a cell exceeds the value set in the overlay attribute value SHOW_DURATION_FLOOD_LEVEL_M |
| SURFACE_FLOW | m3/m2 | Total volume of water passed a grid-cell, scaled by the cell surface (grid cell-size^2) |
| SURFACE_LAST_VALUE | m (min)¹ | Water depth at the end of simulation |
| SURFACE_MAX_VALUE | m (min)¹ | Maximum water depth during the simulation |
| UNDERGROUND_FLOW | m³/m² | Totall infiltration amount from the surface to groundwater |
| UNDERGROUND_LAST_VALUE | m (mm) | The amount by which the groundwater table has risen above the initial groundwater level at the end of simulation |
| UNDERGROUND_MAX_VALUE | m (mm) | The maximum amount by which the groundwater table has risen above the initial groundwater during the simulation |
| WATER_STRESS | m (mm) | The Maximum water depth during the simulation. At water cells only a water depth is shown if the depth exceeds the overlay attribute value ALLOWED_WATER_INCREASE_M |
¹ the units between () are as displayed in the 3D client. If exported to GTiff the SI-convention is used: meters (m) and seconds (s).
Rainfall Overlay Model
The Rainfall Overlay Model will be described in this seciton


Rainfall/Evaporation
Rainfall can be specified uniform for the entire computational grid, using the rainfall overlay wizard. The following can be specified:
- amount: the total amount of rainfall over time (mm)
- duration: the length of the rainfall event
- sines: the amount of peaks (represented by sines) in the rainfall event

Potential evapotranspiration is computed with the following equation:
ETpot = ETc x Kc
Where ETc is the reference potential evapotranspiration, filled in the weather tab of the rainfall overlay. The potential evaporation, computed from meteorological parameters and representative for a reference surface. According to the FAO [1]:
The reference surface is a hypothetical grass reference crop with an assumed crop height of 0.12 m, a fixed surface resistance of 70 s m-1 and an albedo of 0.23. The reference surface closely resembles an extensive surface of green, well-watered grass of uniform height, actively growing and completely shading the ground. The fixed surface resistance of 70 s m-1 implies a moderately dry soil surface resulting from about a weekly irrigation frequency.
Kc is the crop coefficient; a multiplication factor on ETc for converting to potential evapotranspiration. Kc is related to the terrain type specified for the respective cell. If the cell is inundated the value for open water is used.
No unsaturated zone description is available. Therefore evaporation can only take place from the surface and is limited to the total amount of water available on the surface and/or being infiltrated in the sub-soil.
Surface flow
Surface flow is computed, using the diffusive wave approximation in a simple explicit computation scheme:

The basic assumptions behind the implementation of the surface flow computation scheme are:
- Flow velocities are small
- Flow volumes are small
- From (1) and (2) follows: momentum (momentum = mass(volume) * velocity) is small
- And from the above it is assumed all momentum is locally generated by pressure, gravity and friction forces. Momentum on cell XY, has no impact on flow in adjacent cells.
Infiltration
Water stored on the surface, not added to sewer, building storage or evaporated can infiltrate in the subsoil. A cells infiltration capacity is assumed by:
I = min(Ib,Isurf,Kv)
where:
- I is a cells infiltration capacity (m/day)
- Ib is the GROUND_INFILTRATION_MD attribute assigned to the building on the specific cell.
- Isurf is the GROUND_INFILTRATION_MD attribute assigned to the surface of a specific cell.
- Kv is the GROUND_INFILTRATION_MD attribute assigned to the underground of a specific cell. This value should be interpreted as the vertical conductivity (Kv) of the sub-soil.
Groundwater flow
Sewer inflow
Sewer overflow
Structure flow
Outflow
Scope of application
The rainfall overlay is typically used to show impact of heavy rainfall, typically more than 20 mm/hour in urban areas, in flat till mildly-sloped areas. It includes all processes describing what is commonly referred to as pluvial flooding or flash floods.
Please bear in mind the following:
- As the sewer system is simplified to districts, flooding due to sewer surcharge (water ex-filtrating from sewer systems) due to insufficient sewer capacity is excluded
- As the surface water system is simplified to districts, flooding due to over-topping canal embankments is excluded
- The total simulation time is by default divided by 2000 time steps (referred to as cycles). When the total simulation time is increased, the amount of cycles can be increased when necessary to assure accurate simulation results results.
Rainfall overlay wizard
The rainfall overlay can be added to the project multiple times, to present different outcomes or scenarios and compare these, for example for different rainfall amounts. For information on adding and removing the overlay to and from the project, see the page about overlays in general.
When no input data is provided, results will be computed using default values and assumptions. To specify input, the rainfall overlay wizard is developed.
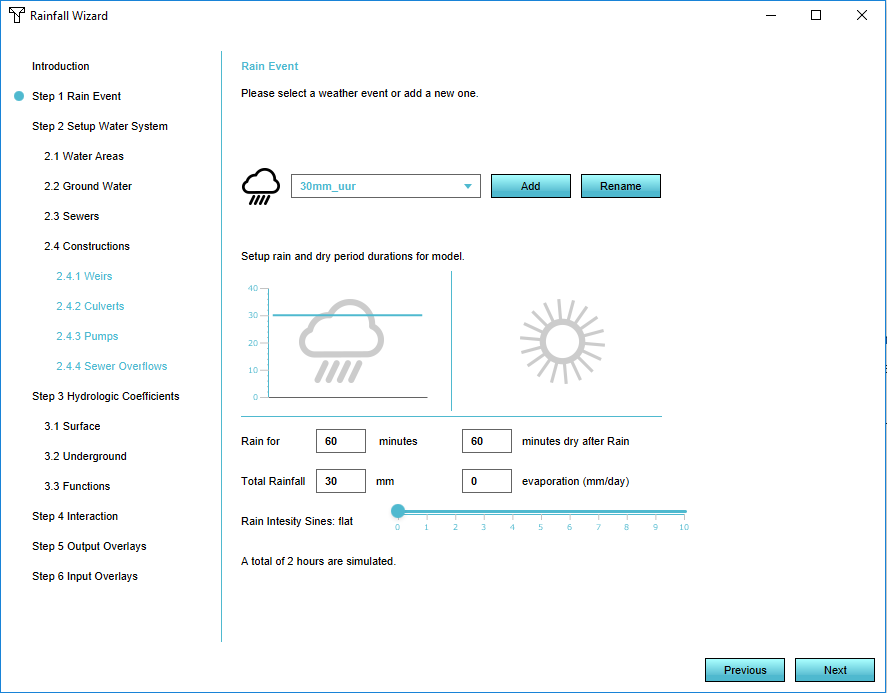
Step 1: Defining the weather
In the first step the weather can be defined. Currently rainfall and evaporation are assumed uniform over the project domain; no variation in space can be specified.
At this screen you can define:
- a rainfall event and give it a name
- the length of the rainfall event and the dry period after the event. The sum of these determine the period over wich a simulation is run
- the total rainfall amount in mm which will be distributed over the length of the rainfall event
- the reference evaporation rate in mm/day
- a rainfall-pattern, currently defined in 1-10 sines, which can be controlled by the slider
Step 2: Setup of the water system
The overlay model can be defined by providing the following data:
- water areas (for now typically peilgebieden)
- sewer districts (rioleringsgebieden)
- hydraulic structures (culverts,weirs and pumps)
- initial groundwater levels
Water areas
Water areas are imported as one or multiple areas and have one uniform representative water level. Water from one water area can flow to an adjacent water areas via hydraulic structures. Water can be extracted from the water system by specification of an outlet.
Water areas are defined by uploading a geojson file. The following attributes are needed for the calculations.
| Attribute | Description | Example | Remark |
|---|---|---|---|
| NAME | The name of the water level area. | PG 256 | This attribute is not loaded in as attribute, but can be used as name to identify the resulting area in the Engine later on. |
| WATER_LEVEL | The height of the water, in meters relative to reference (mNAP in The Netherlands). | -1.5 | This is mandatory information |
| OUTLET | The amount of water which disappears from this level area in cubic meters per second (m3/s). | 1.65 | This could also be the outlet of a gemaal |
Initial groundwater level
This step in the rain overlay wizard provides the possibility to upload a GeoTiff file with groundwater levels in m relative to reference level (NAP in The Netherlands). By default the groundwater level of the water level areas is used (for example the Gemiddelde Hoge Grondwaterstand in Dutch cases). The soil layer between the surface and the groundwater is available for storage.
Sewer areas
The next step allows for the sewer areas to be uploaded. The file is loaded in as a geojson file as areas. The following attributes are needed:
| Attribute | Description | Example | Remark |
|---|---|---|---|
| NAME | The name of the sewer. | Sewer North-East | This attribute is not loaded in as attribute, but can be used as name to identify the resulting area in the Engine later on. |
| SEWER_PUMP_SPEED | The speed at which water is pumped out of the sewer, in cubic meters per second (m3/s). | 0.0012 | |
| SEWER_STORAGE | The amount of water which can be stored in this sewer, in meters (m). | 0.007 | The total amount of storage for this sewer is the surface area of the constructions which are connected to the sewer in this particular sewer area, times this attribute. |
If no sewers exist, the model has no water flowing into sewer containers for storage. Therefore, you can automatically generate these areas. For more information on how the generation of these areas is done or about the sewer system in general, see the Rainfall overlay calculations page.
Hydraulic structures
Water areas can discharge to adjacent water areas and sewer areas can discharge to water areas by means of the hydraulic structures. Hydraulic structures are loaded in the project using the rainfall overlay wizard. The following structures are implemented:
- Weirs, culverts and pumps, connecting water areas
- Sewer overflows, connecting sewer areas to water areas
The following attributes need to be present.
Step 3: Hydrological coefficients
In the next steps of the wizard, hydrological coefficients regarding the surface and the underground terrains, can be edited. For each of these coefficients, representative values are already entered in the forms.
- Water infiltration (m per day): the speed by which the water infiltrates the underground. The speed is also determined by the underground water infiltration factor. From these two values, the lowest value is used.
- Water manning: the Gauckler Manning coefficient, often denoted as n, is an empirically derived coefficient, which is dependent on many factors, including surface roughness and sinuosity. For more information about this formula see the Rainfall overlay calculations page.
- Water evaporation factor: this factor will be multiplied with the general reference evaporation.
- Reference Evaporation (mm per day): The Makking reference evaporation factor. This value ranges from 0.5 mm per day in the winter till 3 mm per day in the summer for the weather station ‘ De Bilt’ in the Netherlands.
- Water storage fraction: the percentage of underground volume that can be used for the storage of water. This number is determined by the difference between the ground water level and the surface height times the surface area.
- Vertical to horizontal infiltration factor: This factor will be multiplied with the vertical infiltration speed, to obtain the horizontal infiltration speed.
Building functions
Since constructions in the Engine have an effect on the flow of the water, for example if a building has a green roof, attributes concerning these values can be adjusted in this step of the wizard. Representative values are already entered in the table. The same values can also be adjusted in the function values window.
Visualization of the water system
In the last step you can choose for a result type, as listed above. If you have provided the water level areas and the hydrological constructions to the Engine, along with the required attributes, a schematic visualization of the water flow from the various water level areas and the hydrological constructions is visible. The red spheres stand for water flowing from a weir to another water level area. The green spheres stand for a weir receiving water from a water level area. The speed of the spheres is based on the WEIR_SPEED and the OUTLET values. If no spheres are visible, the water flows very gently between these water level areas. The pop-ups in the 3D world are panels which mark the middle of the water level area or the place of the hydrological constructions. In these panels, the provided attributes, such as the WATER_LEVEL_M or the WEIR_HEIGHT can also be edited. Play around with this to see how the water flow changes.
Including subsidence
For the calculation of the effects of a severe rainfall, effects of subsidence can be included, such as the recalculated water levels and the changed ground levels. For now, ground water levels affected by the subsidence are not included.
- Add the subsidence overlay. Take note of when to use and how to configure the subsidence overlay.
- In the right panel, select the "Keys" tab
- Select the "Area attribute: output level (m)". Choose a new attribute, for example the WATER_LEVEL_OUTPUT attribute, to write the new water levels to.
- In the Rainfall overlay in the right panel, select the "Keys" tab.
- Choose the overlay for the subsidence model you want to use in the "Include Subsidence" form.
- Also select the newly created attribute containing the water levels in the "Area Attribute: Water Level (m)" form.
- Go to the "General" tab and recalculate the grid.
Be careful not to write the new water levels calculated in the subsidence overlay to the already existing water level attribute, otherwise the subsidence model will be recalculated with incorrect values when refreshing this overlay.
You can play around with the results of the two overlays and compare, for example, two rainfall overlays where one overlay takes the effects of a subsidence model into account and the other overlay shows results without these effects.
| Attribute | Description | Example | Remark |
|---|---|---|---|
| NAME | The name of the weir. | PG 256 | This attribute is not loaded in as attribute, but can be used as name to identify the resulting contruction in the Engine later on. |
| WEIR_HEIGHT_M | The height of the weir (crest level), in meters relative to the reference level used (NAP in The Netherlands). | -1.5 | |
| WEIR_WIDTH | The width of the weir (crest) in meters. | 1.2 | |
| WEIR_COEFFICIENT | The loss coefficient of the weir (a combination of contraction and other losses). | 0.6 | |
| WEIR_N |