How to access your project data in Power BI: Difference between revisions
Jump to navigation
Jump to search
No edit summary |
No edit summary |
||
| Line 23: | Line 23: | ||
File:PowerBI_Export_GeoJSON.png|Copy URL for "Neighborhoods as GeoJSON"-endpoint. | File:PowerBI_Export_GeoJSON.png|Copy URL for "Neighborhoods as GeoJSON"-endpoint. | ||
File:PowerBI_Web_connection.png|Paste the URL and create a web connection. | File:PowerBI_Web_connection.png|Paste the URL and create a web connection. | ||
File:PowerBI_Anonymous_connection.png|Choose anonymous connection. | |||
File:PowerBI_Web_connection.png|Create a table for the GeoJSON web connection. | File:PowerBI_Web_connection.png|Create a table for the GeoJSON web connection. | ||
File:PowerBI_Close_And_Apply.png|Close and apply. | File:PowerBI_Close_And_Apply.png|Close and apply. | ||
File:PowerBI_Bar_Chart.png|Configured bar chart with neighborhood name and number of inhabitants. | File:PowerBI_Bar_Chart.png|Configured bar chart with neighborhood name and number of inhabitants. | ||
</gallery> | </gallery> | ||
Revision as of 14:18, 15 November 2023
Data from projects can be accessed by Power BI using a web connection for the GeoJSON endpoint.
How to access your project data in Power BI.:
- Open any project, and preferable put it on Keep alive.
- Choose an item that you want connect to, such as Neighborhoods
- Hover over Neighborhoods, and in the popup select Export Geo data
- As the format, select GeoJSON (Convert collections to MultiPolygons)
- Click on the second Copy URL button, next to Online GeoJSON Endpoint.
- Open the Power BI Desktop application
- Create a new project or open an existing one.
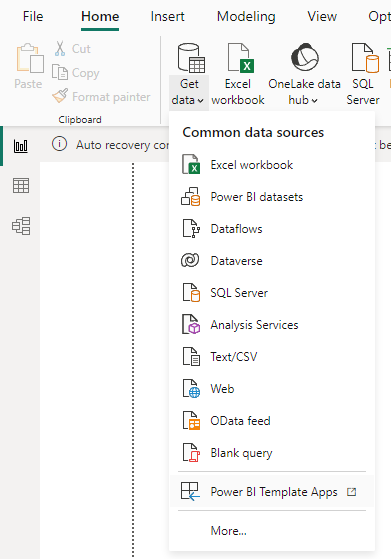
- Under add new data, select web
- Paste the link in the url field and select ok.
- By default, create a table of all the properties.
- Click on the Close and Apply button.
- Add a chart type, such as the bar chart.
- In the detail panel, identify the x data values field.
- In the data panel, unfold the connection item and drag the name field from the list of properties to the x data value field.
- Similarly, select the data field you want a bar chart of, such as "AANTAL_INWONERS" and drag this property to the y data value field.
- The bar chart should now be created.
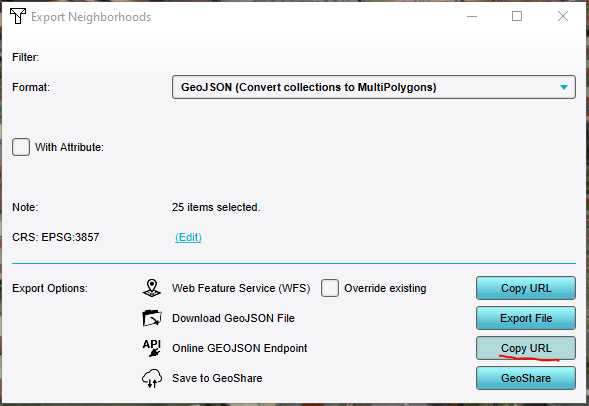
Copy URL for "Neighborhoods as GeoJSON"-endpoint.
Paste the URL and create a web connection.
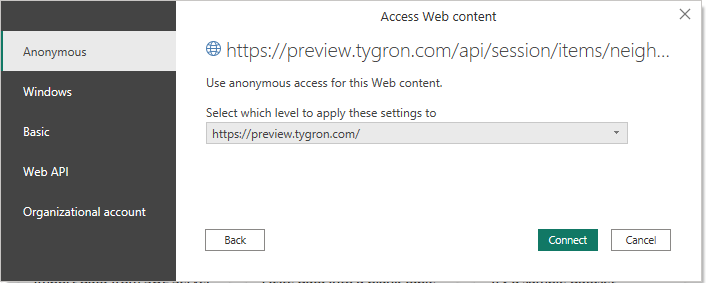
Choose anonymous connection.
Create a table for the GeoJSON web connection.
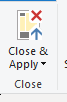
Close and apply.
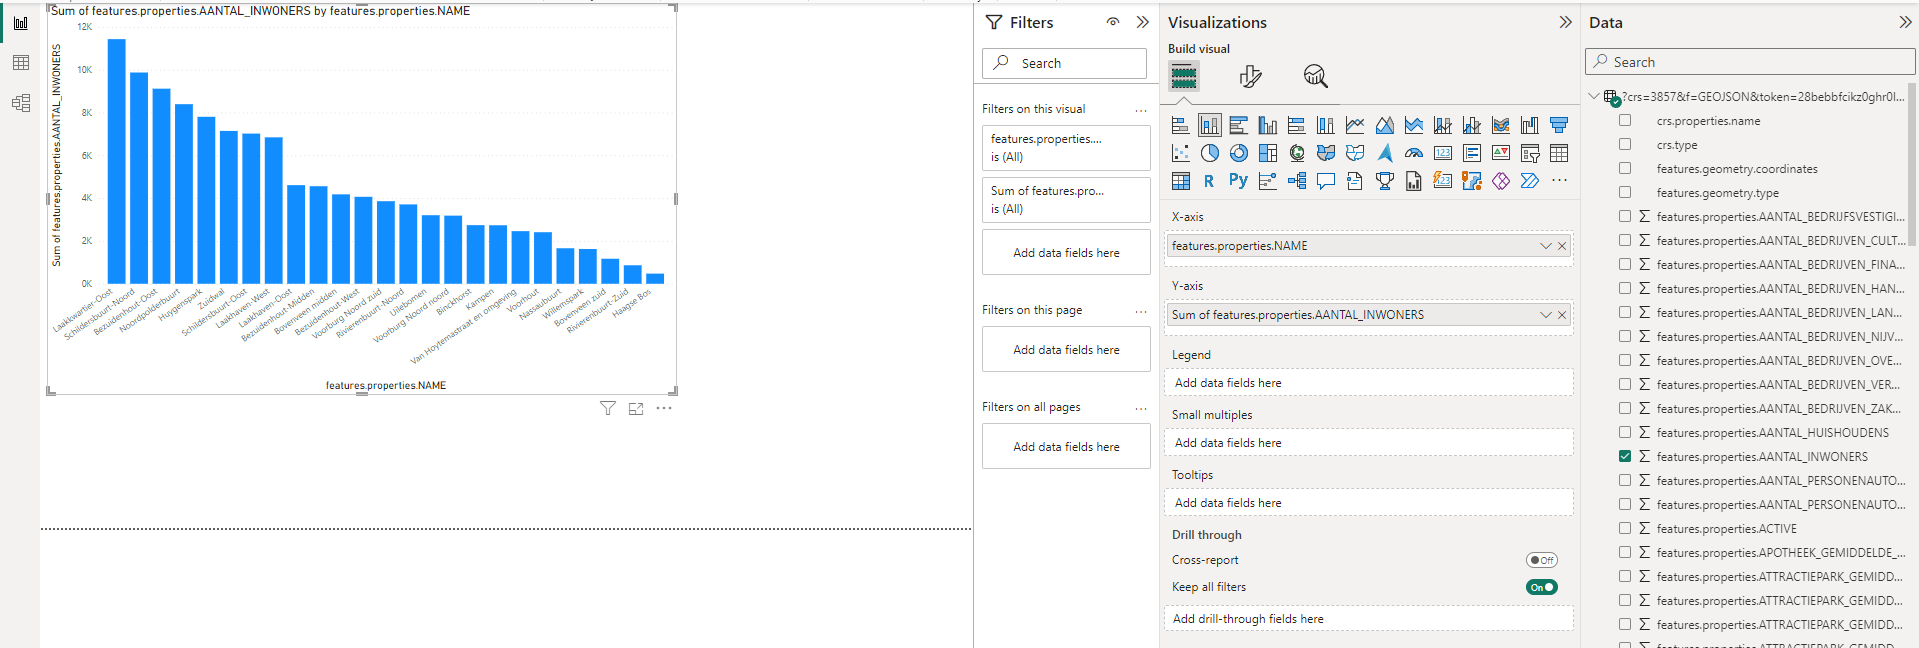
Configured bar chart with neighborhood name and number of inhabitants.


