Networks tutorial
Prerequisites
The following prerequisites should be met before starting this tutorial:
- This tutorial relies on base knowledge about the editor interface. If you have not yet followed the tutorials related to those subjects please do so first.
- This tutorial can be followed with any project of any arbitrary location. Recommended is to create or load a project in the editor with an urban residential area with multiple neighborhoods.
- Microsoft Excel is required for completing this tutorial.
Preparations
Take the following steps as preparation for following this tutorial:
- Start your project. This can be a pre-existing project, or a newly created project.
Introduction to networks
Networks are a separate data layer in a 3D world, intended to model actual resource transport networks, such as for gas, heat, and internet. They are modeled as a mathematical graph consisting of vertices (points) and edges (lines connecting the points).
Networks are composed of a number of datatypes:
- Net Nodes: These form the vertices of the network graph; the individual points which can be connected by lines. Net nodes cannot be directly edited as a discrete datatype as such, but are a relevant datatype to be aware of when working with networks.
- Net Lines: These form the edges of the network; the connections between the points. Net lines are defined by the net nodes they connect, and for the connections between one point on the network and another.
- Net Loads: These form a collection of properties for end-points on the network, and must be connected to any net node which forms an end-point on the network. This means that any net node which has only 1 net line connecting to it should have a net load connected to it. The net load defines the amount of the specified resource the endpoint produces or consumes.
These datatypes form the actual network. However, when discussing networks in the Tygron Platform, the following datatypes are of importance when dealing with networks:
- Net Functions: Just like constructions being defined by a function definition, net lines have a net function definition as well. Any values not defined specifically for an individual net line, are derived from the net function definition.
- Net Clusters: Net loads can be grouped together into clusters, to make interacting with the net loads more manageable for end users. Clusters are not directly part of the network but serve as an interface between the network and end-user methods to interact with the 3D world.
Creating a simple network
A good way to learn how these items work in tandem is to create a small network in which each of these parts are represented.
Pick a location in your map with a little bit of space. You're going to create a small network in this location.
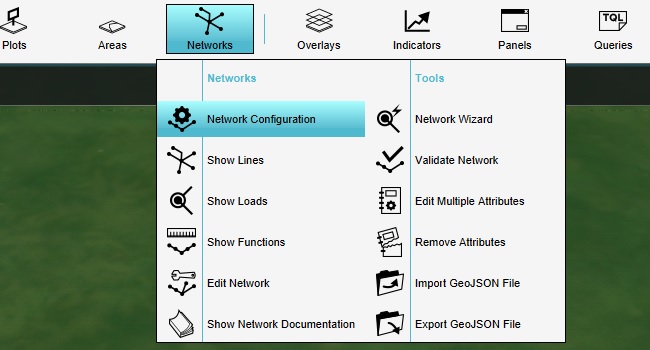
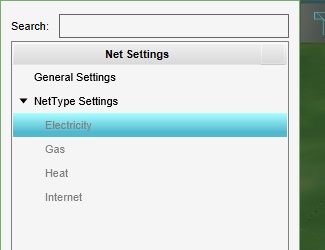
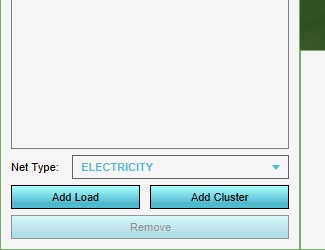
First, activate the electrical network. Select the "Electricity" net type.
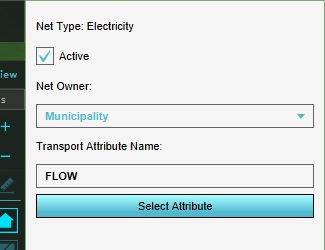
Make sure it's activated in the right panel, by checking the "Active" checkbox.
Drawing networks
Next, we can draw the network.
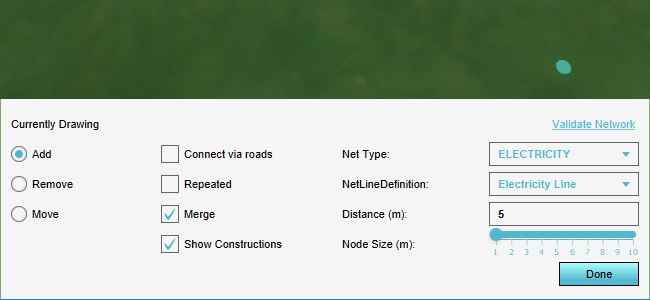
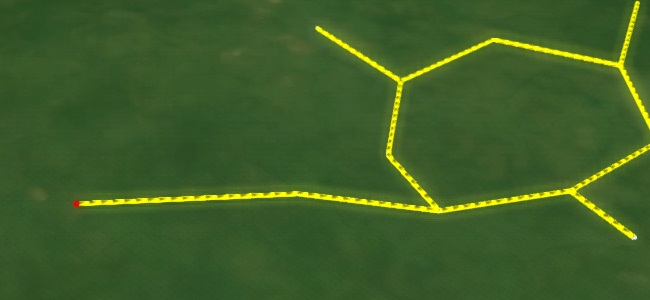
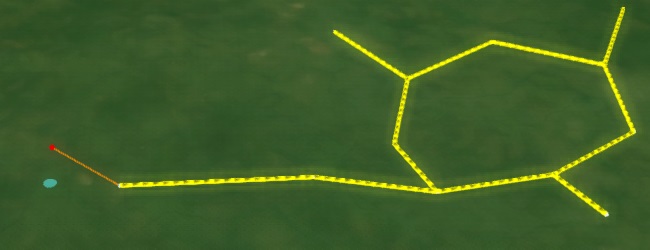
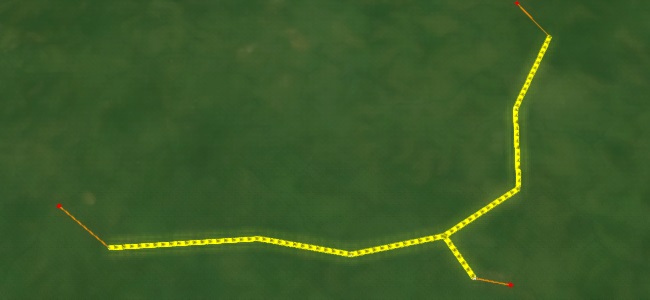
Click in a location in the 3D world to set the first net node location. Click in another location to set the second net node location. You will see a net line appear in the 3D world.
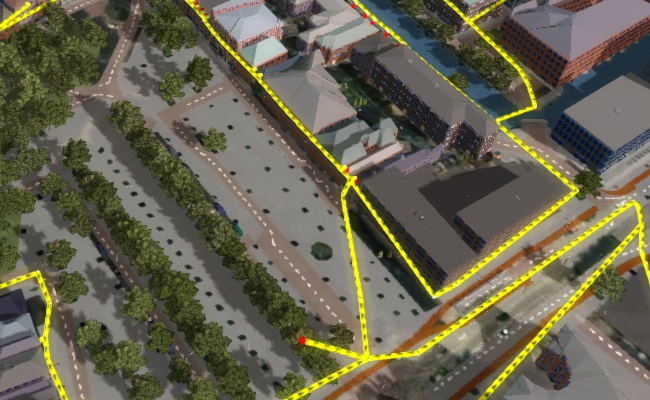
As you move the cursor, you will see a predicted line in bright yellow, which indicates where the next line will be placed when you click again.
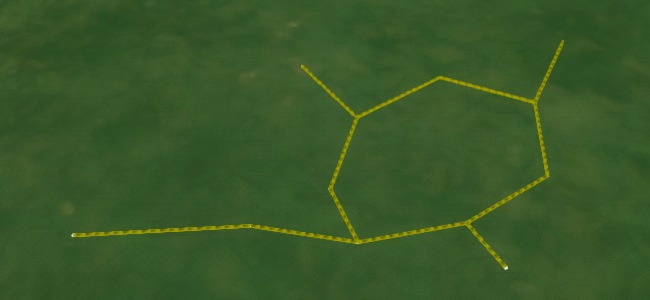
Make the network circle back on itself, letting the last net line connect to one of the intermediate nodes.
If at any point during this proces you place a net line where you don't want one, select the "remove" option in the bottom panel. You can then click on the net line you misplaced to remove it. Then, you can switch the setting back to "Add" to resume drawing new net lines.
Click on the "Add" radio button in the bottom panel to "unfocus" the cursor from the current drawing action. Then click on any node to focus the drawing action there, and create a small offshoot from the network. Repeat this process a few times so the network has a couple of endpoints.
Adding net loads
This series of net lines together form a very simple network. However, right now the network is just a collection of lines between points. The next step is to add net loads, the set of definitions which indicate what happens at a given endpoint.
Add a net load to the project.
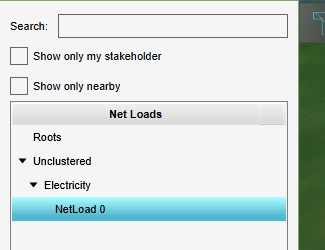
The net load will be grouped in the "Unclustered" category, and then the "Electricity" network category. Select it.
The net load has been created, but it must be connected to a valid endpoint on the network, and it must be given attributes which for the definition of what happens at that endpoint.
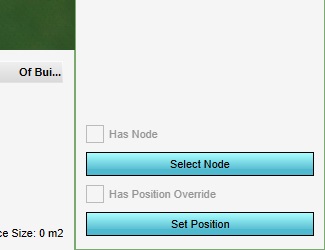
First, we connect the node to an endpoint. Select "Select Node" at the bottom of the right panel.
Next, click on the first endpoint of the network. You will see the load is placed on the exact same location of the net node you clicked on.
Often times, the indicative location of the net load is not identical to the exact location of the endpoint of the network. For this reason, it is also possible to set a location for the net load which is more representative of where the load for the network is really coming from. At the bottom of the right panel, select "Set Position".
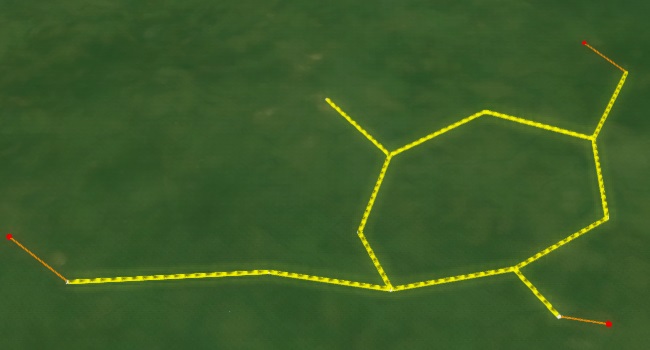
Next, click near the endpoint where the net load is connected. You will see the net load appear in the location that you clicked. It will still indicate the net node it is connected to via a line.
Notice that the network itself is unaltered. The net lines as we have drawn them are still the same.
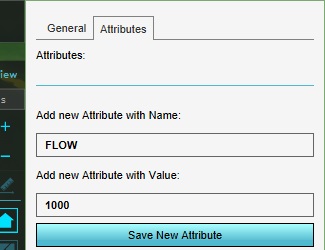
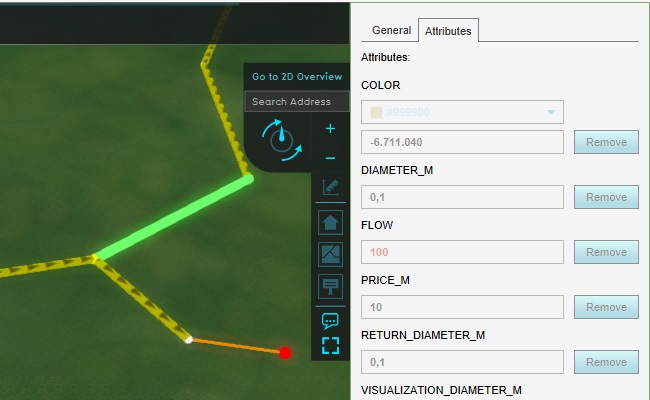
Now that the net load has been associated with the network, attributes must be added to it to define its effect on the flow of the network. Switch the right panel to the "attributes" tab, and add a "FLOW" attribute with a value of 1000.
This net load now defines the connected net node to be a point of resource production. In terms of an electricity network, this would for example be a power station.
Add 2 more net loads to the project. Give them a "FLOW" attribute of -100, and connect them to different end-points on the network.
Because the net loads have a negative "FLOW" attribute, their associated net nodes are points of resource consumption. In terms of an electricity network, this would for example be a house, or a factory.
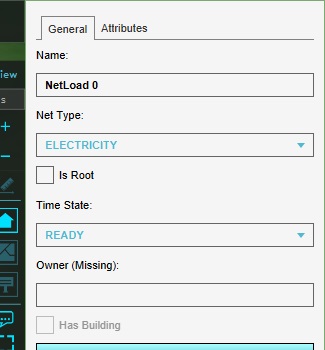
For our initial inspection of the network, it will also be desirable to set the timestate of all net loads to "READY". The timestate predicates whether the net load is actually "active" on the network. In other words, it sets a net load to be connected or disconnected to the network, and thus whether to take their "FLOW" into account during calculations. "NOTHING" means the net load is disconnected. "READY" means the net load is connected and active.
For each net load, change the timestate from "NOTHING" to "READY".
Lastly, we need to set a "root" for the network. This is a net load which serves as a sort of anchor for calculations. By convention, if a network only has a single producer it is usually set as root.
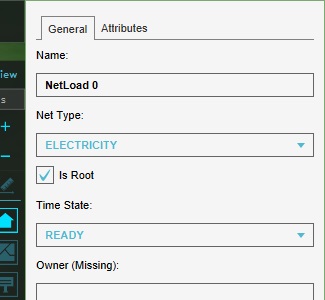
Select the producer net load, and in the "General" tab make sure "Is Root" is checked. This sets this net load as the root of the network.
It will now also be listed in the left panel under the "Roots" category, rather than "Unclustered".
Network calculations
Now start a testrun. You may see parts of the network disappear. Specifically, the parts of the network which are not on the path between the consumers and the producer.
Select a net line, and inspect the "FLOW" attribute. Repeat this for a number of net lines, and see that the net lines have varying "FLOW" attributes.
This forms the basis of simple, manual network creation and configuration.
Assignments
These assignments guide you to further explore the basic calculation functionality already exposed with a basic network.
- Increase the amount of electricity the consumers require, so that the sum of their consumption exceeds that of the producer. Inspect the net lines during a testrun to see the consequences.
- Add an additional branch to the network, which then branches into two endpoints. Add an additional consumer to one endpoint, and an additional producer to the other endpoint. Inspect the net lines during a testrun to see the consequences.
- Set the timestate of one or two net loads to "NOTHING". Inspect the net lines during a testrun to see the consequences.
Network generation
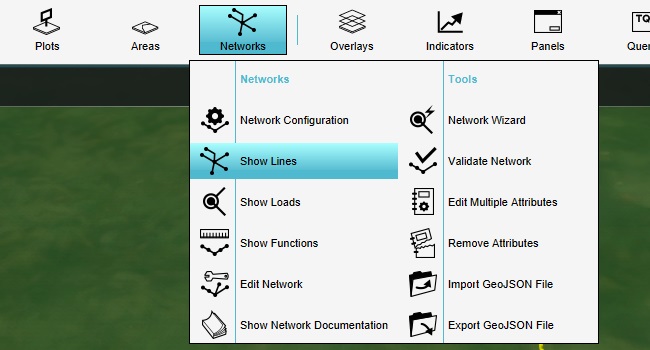
Creating a network manually is only rarely the preferred situation, especially when dealing with larger project areas. For these situations, the Tygron Platform also offers a wizard to generate a complete network automatically.
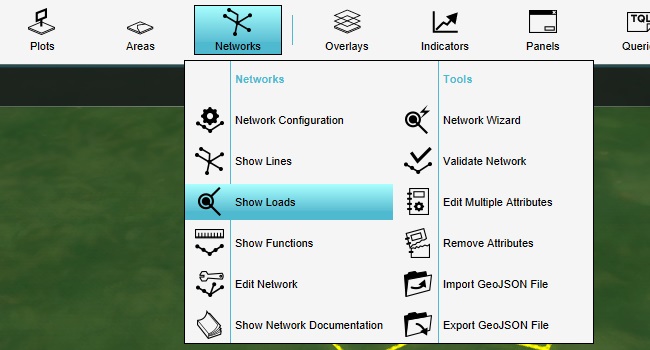
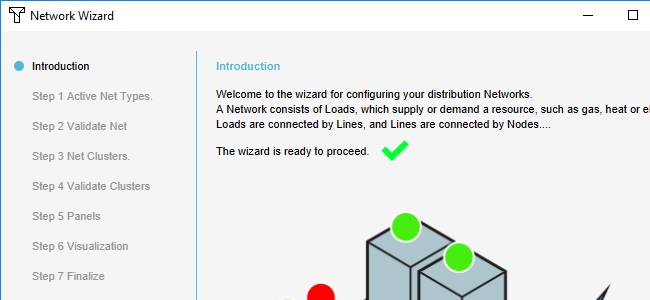
Open the network wizard.
The wizard will guide you through the process, but during the generation process a number of questions will require your input. For any question posed without an explicit instruction listed here, simply use the default settings.
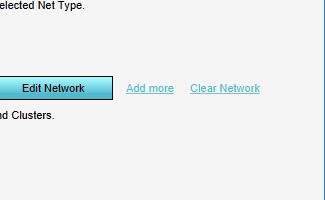
One of the first questions posed is which network type to edit. Select the "ELECTRICITY" network, and opt for "Clear Network" (including the Root Load). This will delete the entire network as it had been created so far.
Then opt to edit the network of the "ELECTRICITY" network type.
When prompted, opt to generate a (new) set of net loads.
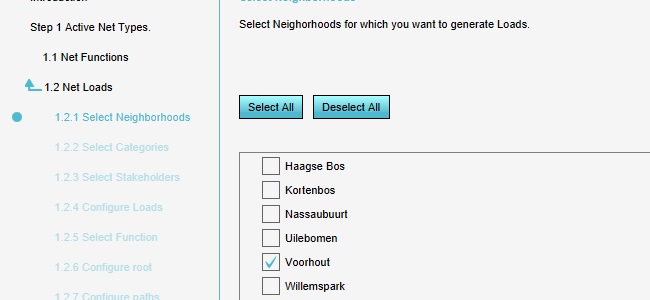
When prompted, select a neighborhood in your project with residential buildings.
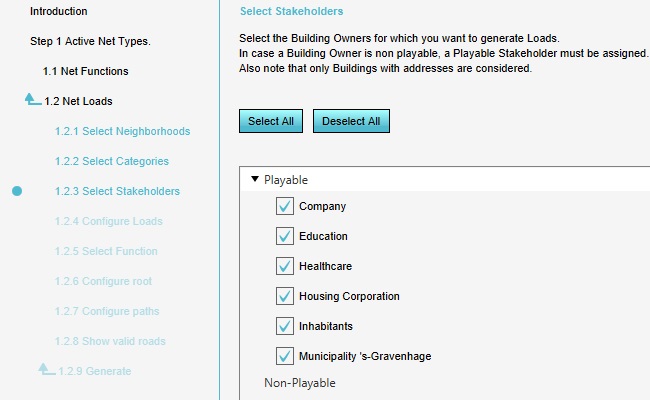
When prompted, select all stakeholders.
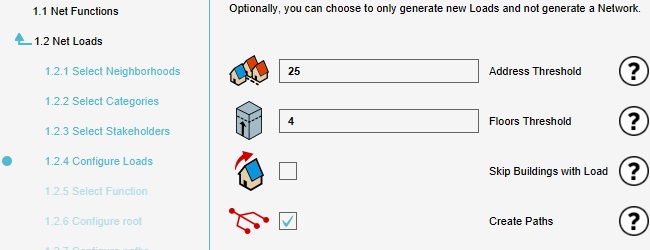
By default, one of the selected options in the wizards is to simultaneously create the paths connecting all the net loads. This will automatically enable a number of additional wizard steps to perform this process. Make sure this options is still checked when continuing past the screen with this option.
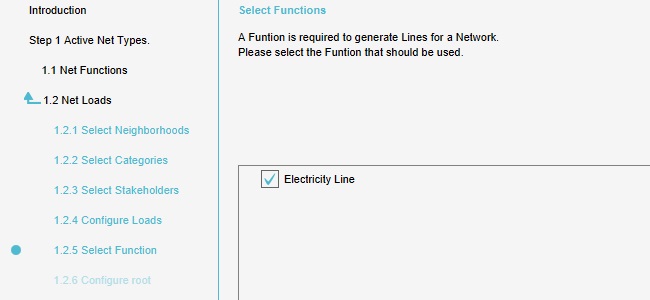
When prompted, select the default Electricity line function.
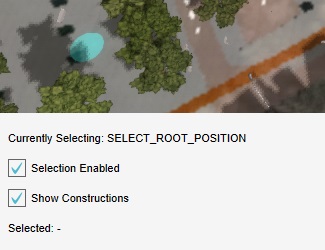
You will be prompted to place the initial root of the network somewhere in the 3D world. Opt to draw the root load in the map (and to switch to the 3D View to perform the action).
Click in a location in the 3D world to place the root load there. Preferably, place it near the edge of the residential neighborhood.
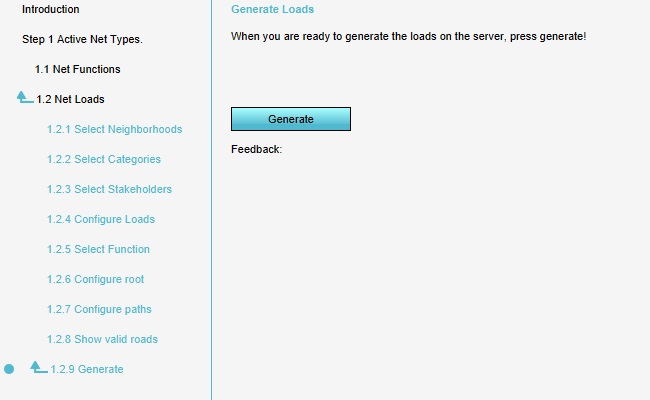
Finally, you will be prompted to initiate the actual process of generating the network. Click on "Generate" to begin this process.
After the generation process has completed, you will be able to finish this step of the wizard.
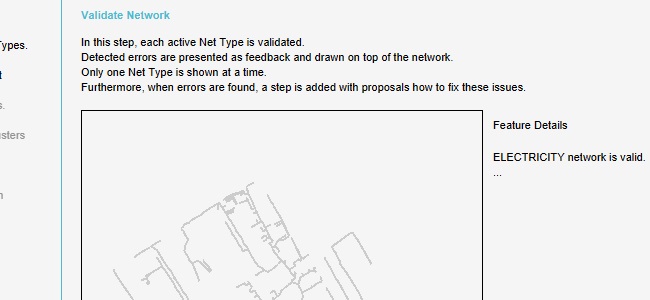
The results pass through a validation step. If everything went well, it should report that the network is valid. However, it is possible that the generation algorithm has caused a few minor errors, such as a few loads placed in locations where the network cannot reach. In these cases, the wizard will ask how to fix these issues. For the purpose of this tutorial, it is sufficient to opt to delete any erroneously unconnected sections.
This concludes the generation of the network itself. If you minimize (not close) the wizard window, you will be able to see the network in the 3D world.
Next, the wizard can guide you through the generation of the associated clusters for the network. Opt to generate clusters.
When prompted, select all neighborhoods. The neighborhoods listed include only those with net loads. Notice that this might be more neighborhoods than when you generated the network, if any net loads have been placed on or near the edge of certain neighborhoods.
When prompted, select all stakeholders.
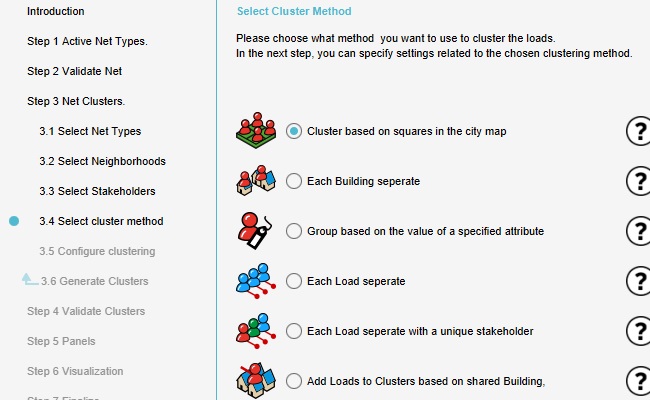
For the cluster method, take a moment to inspect the options available for cluster generation. However, the default option for cluster generation (generating clusters based on squares in the city map) is appropriate.
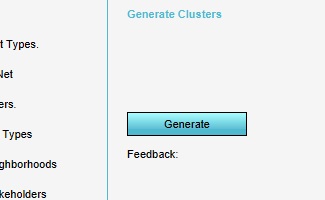
Finally, you will be prompted to initiate the actual process of generating the clusters. Click on "Generate" to begin this process.
After the generation process has completed, you will be able to finish this step of the wizard.
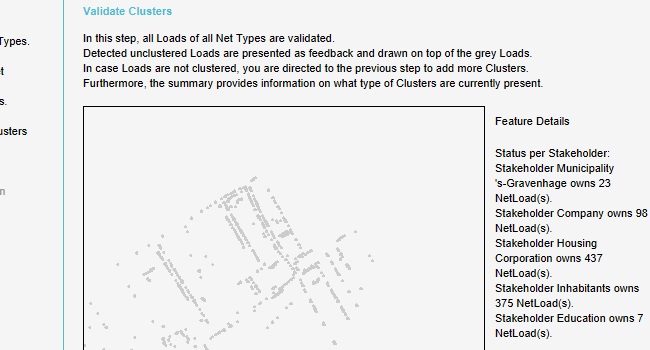
The results pass through a validation step. If everything went well, it should report that all loads in the network have been clustered. However, it is possible that the generation algorithm has caused a few minor errors, such as a few loads which have not been clustered. You will be informed that these net loads need to be removed from the project. In the editor interface, open the list of all net loads, and remove all net loads which are still categorized in the "unclustered" category.
Now that the clusters have been generated, the potentially hundreds or thousands of net loads in the project area have been grouped in at most a few dozen clusters. These collections of net loads allow a large number of net loads to be controlled en masse. The wizard will offer to generate a set of standardized interaction panels to allow this control.
Opt to generate Template Excel Panels.
A new template panel will be created. This requires no further work to configure.
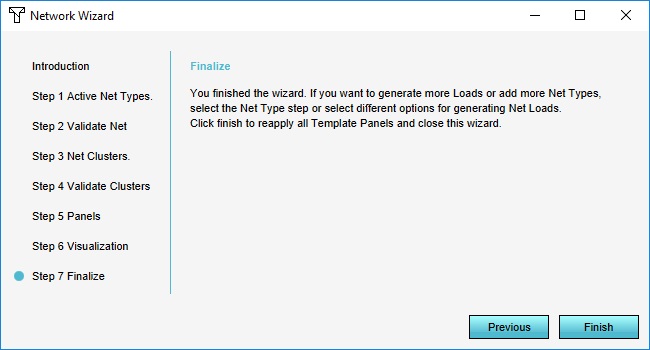
Continue through the remaining steps of the wizard and complete it. The wizard window will close and you will be returned to the 3D world.
Feel free to look around the 3D world and see how the network has been generated.
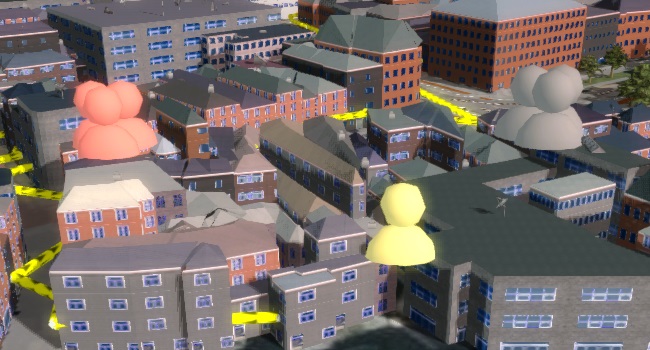
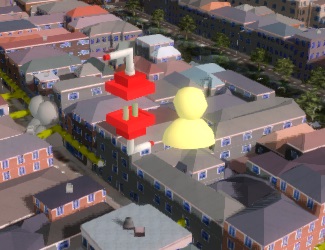
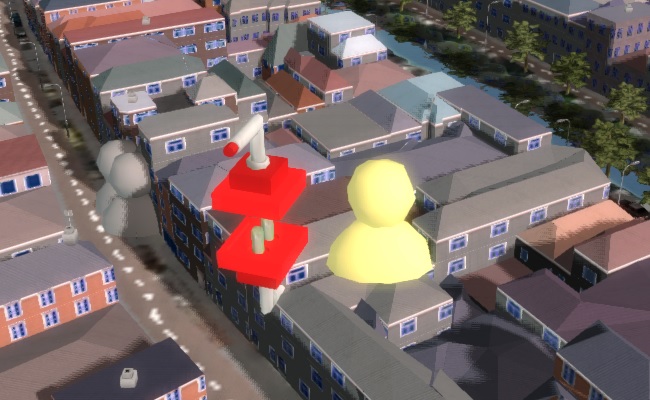
Take note of the cluster symbols which have appeared.
These mark the locations of clusters of net loads. They consist of one or more colored figures. The quantity indicates whether the cluster should be considered a clustering of individual connections, or a single connection serving multiple addresses. The color indicates which stakeholder owns the cluster.
Find a cluster, and switch to the stakeholder associated with the cluster.
You will see a popup is available in this stakeholder's perspective, associated with the cluster.
Click on it to open the panel related to the cluster.
It will display some basic information on the connections which are grouped together in this cluster.
Close the panel for now.
Interacting with a generated network
Start a testrun.
You will notice that the entire network has disappeared at the start of the testrun. This is because one of the default settings in the network wizard is to generate the network in the timestate "NOTHING", meaning all (consumer) net loads begin as disconnected.
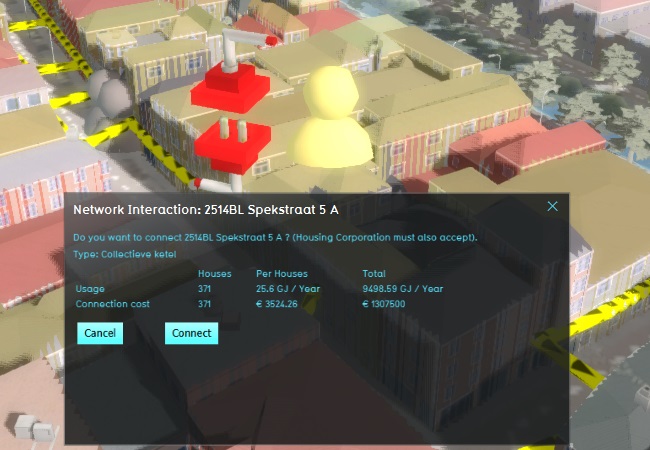
Click on the popup again, and click on "Connect". This will fire a request to connect all the connections of the cluster to the network.
Notice that the net lines have now reappeared in the session, but only the net lines which lead to the connections which have been connected as part of the cluster. If you zoom out you can see more clearly that only some of the net lines have (re)appeared.
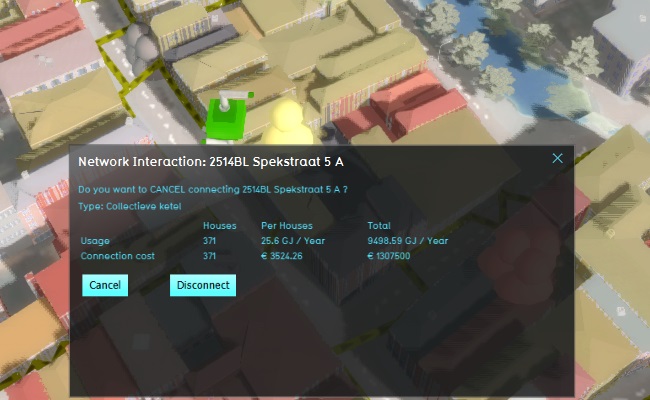
Reopen the popup, and click on "Disconnect". This will undo the connections and return the network to an entirely disconnected state.
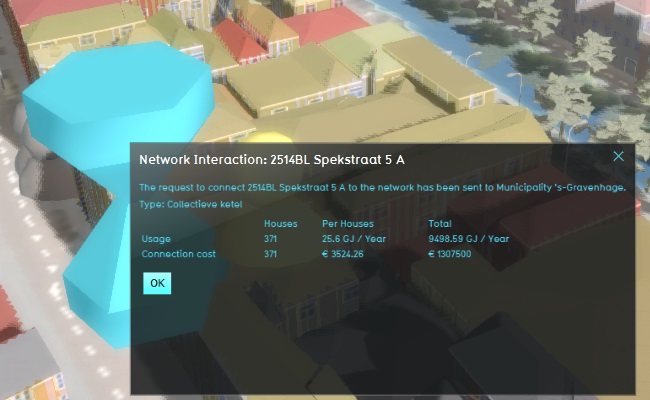
After this has completed, click on "Connect" again. The popup will indicate that a request to make these connections has been sent to the network owner.
What parts of a network are or aren't connected are decided by all relevant stakeholders together. By default, the configuration provided for to approach this use-case allows for the first connection to be made unilaterally, but if any party has decided to undo that connection, the next time such a connection is to be made both parties must agree to it: both the owner of the connections and the owner of the network.
Stop the testrun, and go to

