Web interface tutorial
Prerequisites
The following prerequisites should be met before starting this tutorial:
- This tutorial relies on base knowledge about the editor interface, the creation of panels, and the ability to script in HTML, CSS, and JavaScript. If you have not yet followed the tutorials related to those subjects please do so first.
- This tutorial can be followed with any project of any arbitrary location.
- You will need an IDE or environment in which to edit HTML, CSS, JavaScript. For example: Notepad is sufficient.
Preparations
Take the following steps as preparation for following this tutorial:
- Start your project. This can be a pre-existing project, or a newly created project.
- Start your preferred IDE. It will be required in the later stages of the tutorial.
Introduction to the Web interface
The web interface is a web-based interface with which a project in the Tygron Engine can be presented. It is a web page, built up using HTML, CSS, and JavaScript, generated and served by the Tygron Engine. By default, data presented by the web interface includes the 3D world (although flattended into a 2D map), indicators present in the project, and the available overlays. Each stakeholder in a project has their own unique web interface available, similar to how they have their own perspectives in the 3D client.
Accessing the Web interface (from the editor)
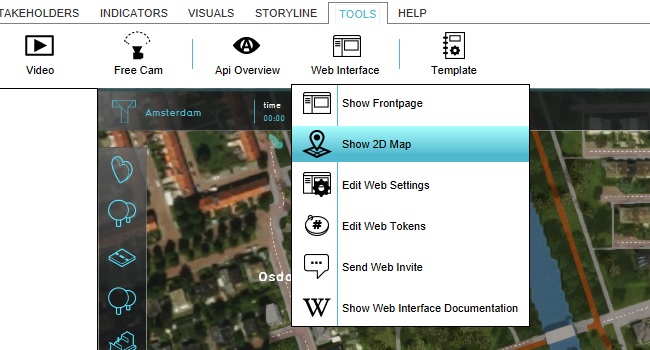
To access the Web interface from the editor, go to: Template:Editor ribbon
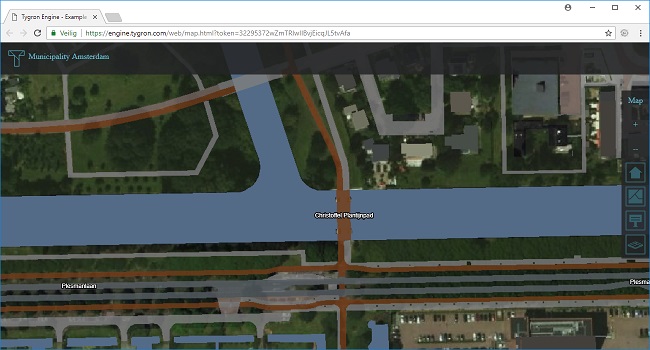
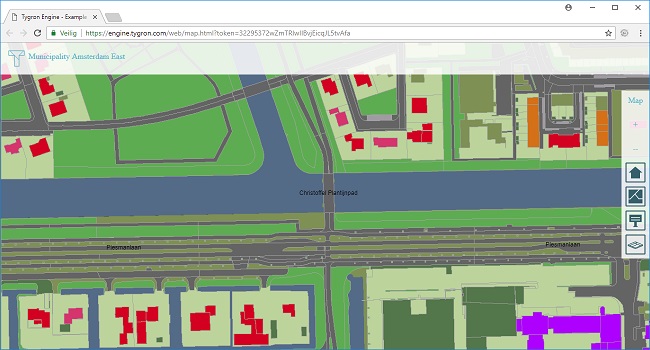
This will open the default browser on your computer, directed at the link https://engine.tygron.com/web/map.html?token=TOKEN (in which "TOKEN" is replaced with a proper authentication token.) The web interface opened will be the web interface for the stakeholder currently selected in the editor.
Web interface compared to the Session interface
The first thing you will notice is that the web interface offers no editing tools. It is a parallel for the session interface only, meaning that end-users will only be able to interact with the session they are currently in. The web interface is not used for editing project data in the same manner as the editor.
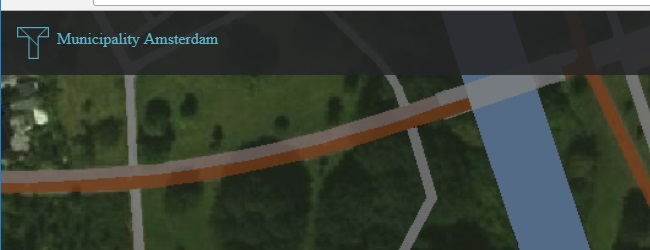
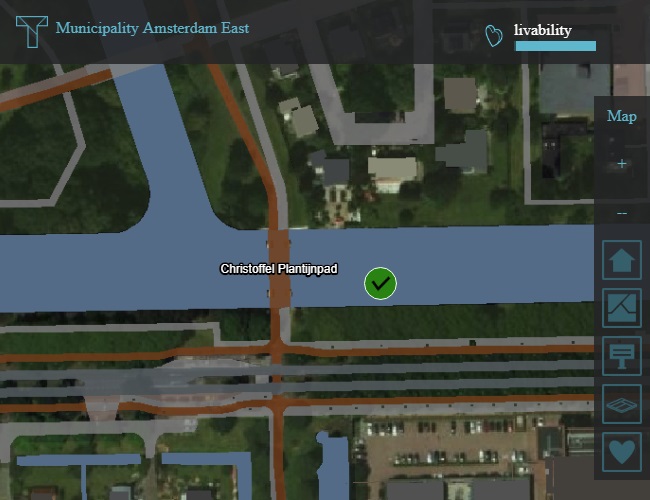
The second thing is that the web interface matches the session interface in most general areas. There is a top bar which displays the name of the current stakeholder, and the individual indicators in the project which are visible to the stakeholder. (In the example image, no indicators are present in the project yet, so no indicators are present in the web interface either).
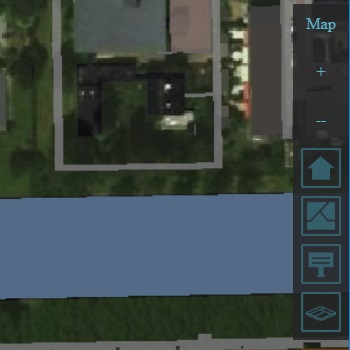
There is also a panel on the right of the screen, with familiar overlay buttons. These too are the overlays available to the currently selected stakeholder.
The third thing is that the web interface does not feature any action menus, even though the stakeholder does have them in the session interface in the 3D client. For interactions based on the action menus, such as drawing locations for new constructions or performing terrain alterations, the 3D client is required.
Changes in (project) data
The session interface is made to respond to most changes in the project data or in the running session, but explicitly not all changes. A rule of thumb is that data which may change during a proper session are updated, but data which is defined at editing-time and unchanging for the duration of a session or testrun do not. This is illustrated as follows.
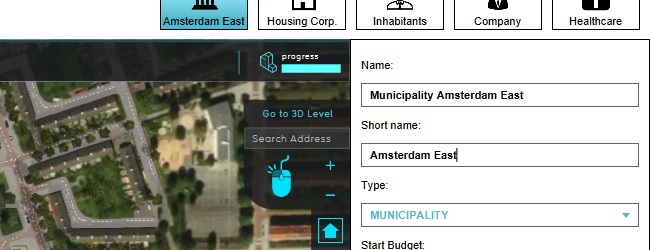
In the editor, edit the stakeholder you have currently selected: Template:Editor ribbon Edit both the (full) Name and the Short name of the stakeholder.
Notice that in the 3D client, the name of the stakeholder is updated. But that in the 2D client, the name is unchanged. This is because although readily changed in the editor, during a session the name of a stakeholder never changes.
Refreshing the page will cause the name in the web interface to be updated.
In the editor, add the livability indicator to your stakeholder. (If your stakeholder already has a livability indicator and overlay, remove the livability indicator and overlay from the project instead.)
Notice that in the web interface, the indicator you just added to the project is also immediately added to the web interface. (Or if you removed it, that it is removed.) During a session, an indicator may become available or unavailable to a stakeholder, so the web interface automatically updates to reflect this change.
However, the change in available overlays is not automatically reflected in the web interface, because the availability of overlays does not change during a proper session.
Refresh the web interface again to update the list of overlays.
Changes in session data
Make sure the project has a livability indicator, a livability overlay and a text panel with a popup in the 3D world.
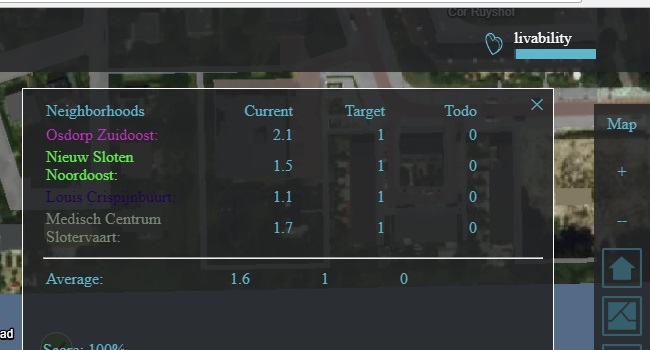
Click on the indicator entry to open it, similar to how you would in the session interface. You will see the indicator panel appear, in the same manner as you would expect in the session interface.
In the editor, effect a change in the indicator. For example: change the target, or the description of the indicator.
Notice that the change does not automatically propagate to the panel contents. However, when you click on the indicator again in the top bar, the panel contents will be refreshed and you will see the change you have made. Close the panel.
Click the text panel's popup in the web interface. A panel will appear with whatever content you have specified for it.
In the editor, change the text of the panel.
Notice that the change does not automatically propagate to the panel contents. However, when you click on the popup again, the panel contents will be refreshed and you will see the change you have made. Close the panel.
Select the livability overlay in the web interface. You will see the livability overlay appear in the web interface, in the same manner as you would expect in the 3D client.
In the editor, change the legend of the livability overlay so that every value is represented by a purple hue. (You can do this by going to Geo Data → Overlays → Livability Overlay, and selecting the "Legend" tab. There, select each color and change it to a purple color.) The colors do not need to be easy to interpret, they just need to be clearly different from the default colors.
You will see the overlay update immediately.
You will have noticed that the behavior between the panels and indicators, and the overlay, differs. The difference in behavior stems from the fact that data of the panels and the indicators are retrieved only once, when they are requested. At that time, the Tygron Engine will provide the web interface with the most recent determined content. Neither the Tygron Engine, nor the web interface, track whether the contents have changed in such a way that an update is required. This tracking does occur with the overlay. In principle, only when the end-user select an overlay is the relevant data retrieved from the Tygron Engine. However, the web interface is notified when new overlay information is available. If the overlay is opened, the newest data is automatically retrieved.
Remove the livability indicator, the livability overlay, and the text panel.
Web settings
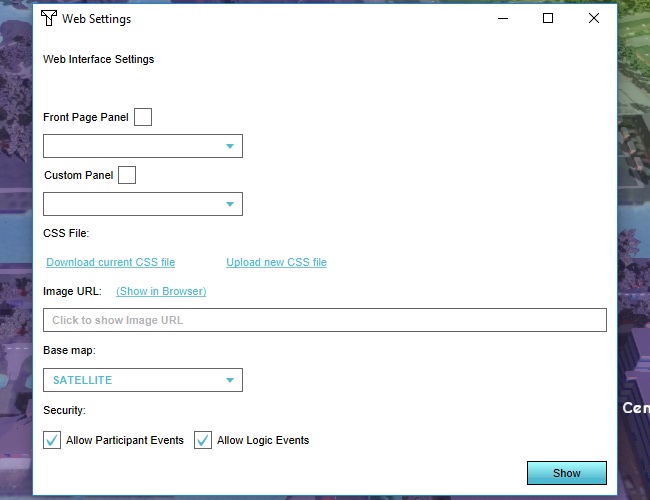
It's possible to configure the web interface with a number of settings, allowing for complex modifications of its appearance and behavior. To access the web settings, go to: Template:Editor ribbon
CSS
Part of the web interface is the CSS file, which by default determines the styling of the entire web interface. This file can be downloaded, altered, and uploaded to change the styling of the web interface.
Select "Download current CSS file" to download the CSS file, and open it in your IDE of choice to edit it.
Add the following lines to the end of the CSS file:
.ui {
    background-color: rgba(255,255,255,0.85);
}
Save the file. Now select "Upload new CSS file", and select your modified CSS file. When the upload is complete, refresh the web interface to see the changes.
By adding the above line to the CSS, the styling of the entire web application has been modified. Specifically, every element of the interface of the class "ui" now has a white, slightly transparent background, as opposed to the slightly transparent black background color it was by default.
If is important to note that while this styling has changed the web interface's appearance, the session interface in the 3D client is unchanged.
Add the following lines to the end of the CSS file:
body {
	background-color: rgba(128,32,32,0.8);
	opacity:0.5;
}
Save and upload the file.
