Heat Stress Module benchmarks: Difference between revisions
No edit summary |
No edit summary |
||
| Line 1: | Line 1: | ||
The {{Template:Heat_DPRA_Report}} includes reference information on the city of Wageningen on 02-08-2013. | The {{Template:Heat_DPRA_Report}} includes reference information on the city of Wageningen on 02-08-2013. This data is relevant as it correlates with actual measurements for Wageningen. The PET measurements for this exceptionally hot day are comparable to the default 01-07-2015 reference case for Wageningen. | ||
The performed benchmark has an average difference below '''0.68%''' for the selected measurement points. | The performed benchmark has an average difference below '''0.68%''' for the selected measurement points. | ||
| Line 14: | Line 14: | ||
==Point Measurement Analysis== | ==Point Measurement Analysis== | ||
Several points have been compared for results. | Several points have been compared for results. Points were selected where spatial conditions (e.g., foliage and vegetation fraction) are similar for both PET calculations. | ||
[[File:Wageningen_2013_08_02_measurementpoints.png|right|x500px|thumb|Location of the measurement points in blue.]] | [[File:Wageningen_2013_08_02_measurementpoints.png|right|x500px|thumb|Location of the measurement points in blue.]] | ||
| Line 68: | Line 68: | ||
|} | |} | ||
The average difference in calculated PET for these spatially similar points is '''0.68%'''. | |||
==Setup== | ==Setup== | ||
Revision as of 12:15, 8 July 2026
The DPRA Heat stress report includes reference information on the city of Wageningen on 02-08-2013. This data is relevant as it correlates with actual measurements for Wageningen. The PET measurements for this exceptionally hot day are comparable to the default 01-07-2015 reference case for Wageningen.
The performed benchmark has an average difference below 0.68% for the selected measurement points.
Results
The PET Benchmark result overlays can be seen below:
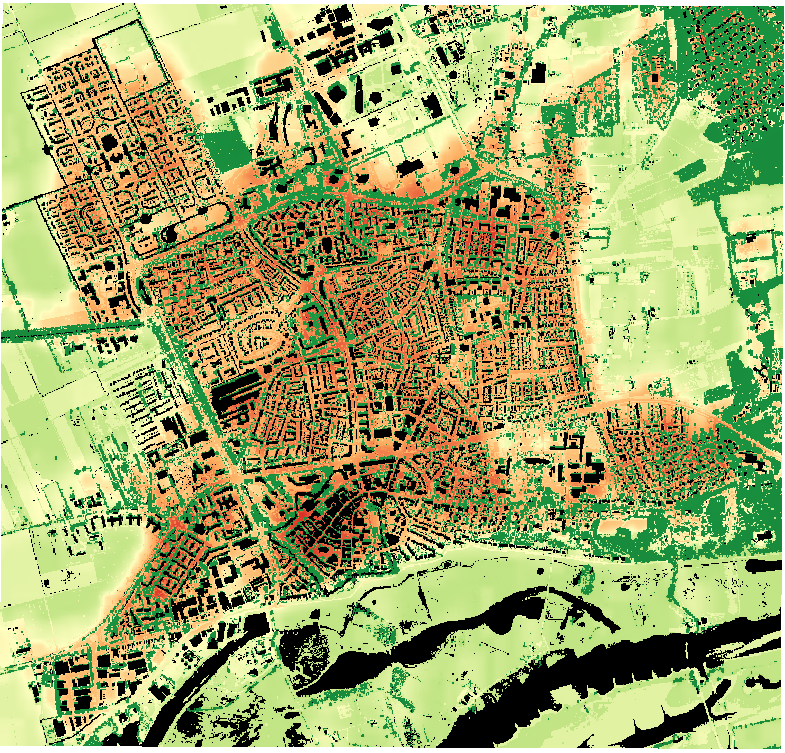
PET daytime map for August 2, 2013 12 UTC with the meteorology of the reference station Herwijnen from the DPRA Heat stress report 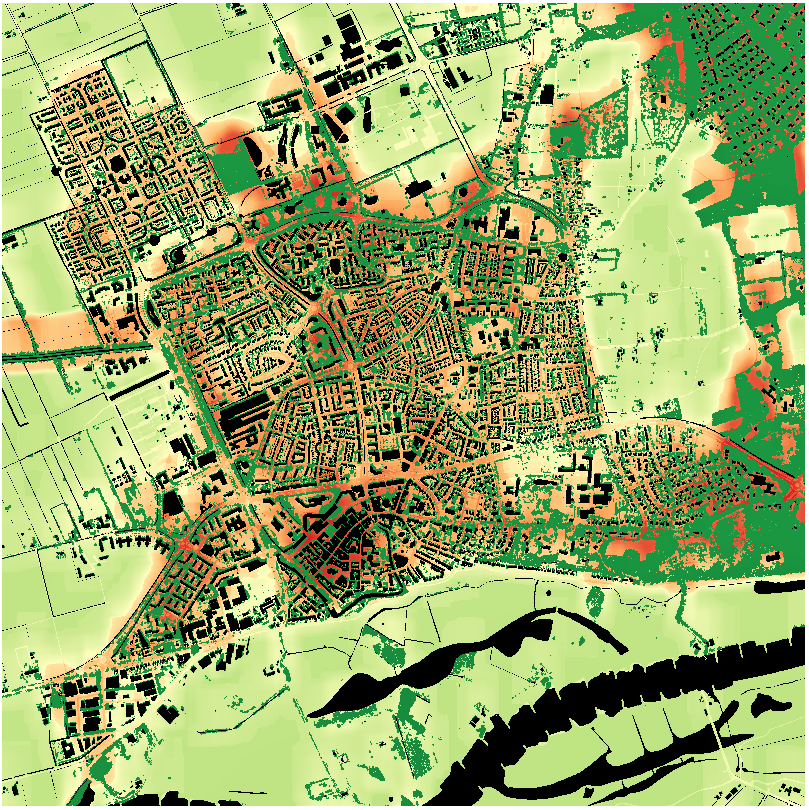
PET daytime map for August 2, 2013 12 UTC with the weather data from the reference station Herwijnen as calculated by the Tygron Platform 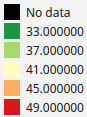


Point Measurement Analysis
Several points have been compared for results. Points were selected where spatial conditions (e.g., foliage and vegetation fraction) are similar for both PET calculations.

| id | Wageningen PET | Tygron PET | Difference (%) |
|---|---|---|---|
| 01 | 46.12 | 46.13 | 0.022 |
| 02 | 47.44 | 48.04 | 1.26 |
| 03 | 47.11 | 47.52 | 0.87 |
| 04 | 44.70 | 44.99 | 0.65 |
| 05 | 40.53 | 40.48 | -0.12 |
| 06 | 38.69 | 38.67 | -0.05 |
| 07 | 42.52 | 42.45 | -0.16 |
| 08 | 44.87 | 44.03 | -1.87 |
| 09 | 43.62 | 43.02 | -1.38 |
| 10 | 46.79 | 46.58 | -0.45 |
| 11 | 38.70 | 38.79 | 0.23 |
| 12 | 44.40 | 44.00 | -0.90 |
| 13 | 46.34 | 46.29 | -0.11 |
| 14 | 45.58 | 45.77 | 0.42 |
| 15 | 39.05 | 39.42 | 0.95 |
| 16 | 38.22 | 38.28 | 0.16 |
| 17 | 43.23 | 43.88 | 1.50 |
| 18 | 46.34 | 46.49 | 0.32 |
| 19 | 45.59 | 44.84 | -1.65 |
| 20 | 46.21 | 45.96 | -0.54 |
| Average | 0.68 |
The average difference in calculated PET for these spatially similar points is 0.68%.
Setup
Weather data from weatherstation Herwijnen has been used for this test case. The used values are:
| Variable | Value |
|---|---|
| Date | 02-08-2013 |
| Hour of day | 14 |
| Sun altitude | 55.5 |
| Sun azimuth | 186.9 |
| Sun daily motion factor | 0.063 |
| Humidity (%) | 56 |
| Sun radiation (W/m2) | 774 |
| Temperature (°C) | 31.7 |
| Wind speed (m/s) | 4 |
| Wind direction (°) | 140 |
| Daily min. temperature (°C) | 18.9 |
| Daily max. temperature (°C) | 34.1 |
| Daily avg. radiation (W/m2) | 455 |
| Daily avg. wind speed | 3.17 |
The foliage height will be defined by a GeoTIFF. See the images (overview and zoomed in east-south-east corner) below:
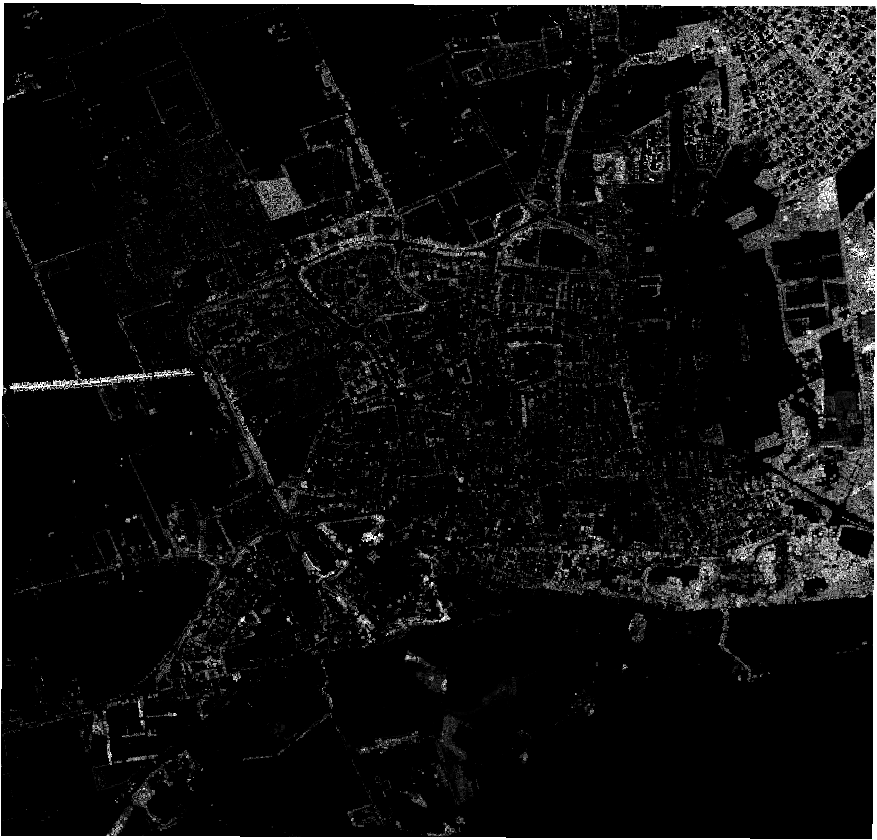
Overview of the foliage height in Wageningen 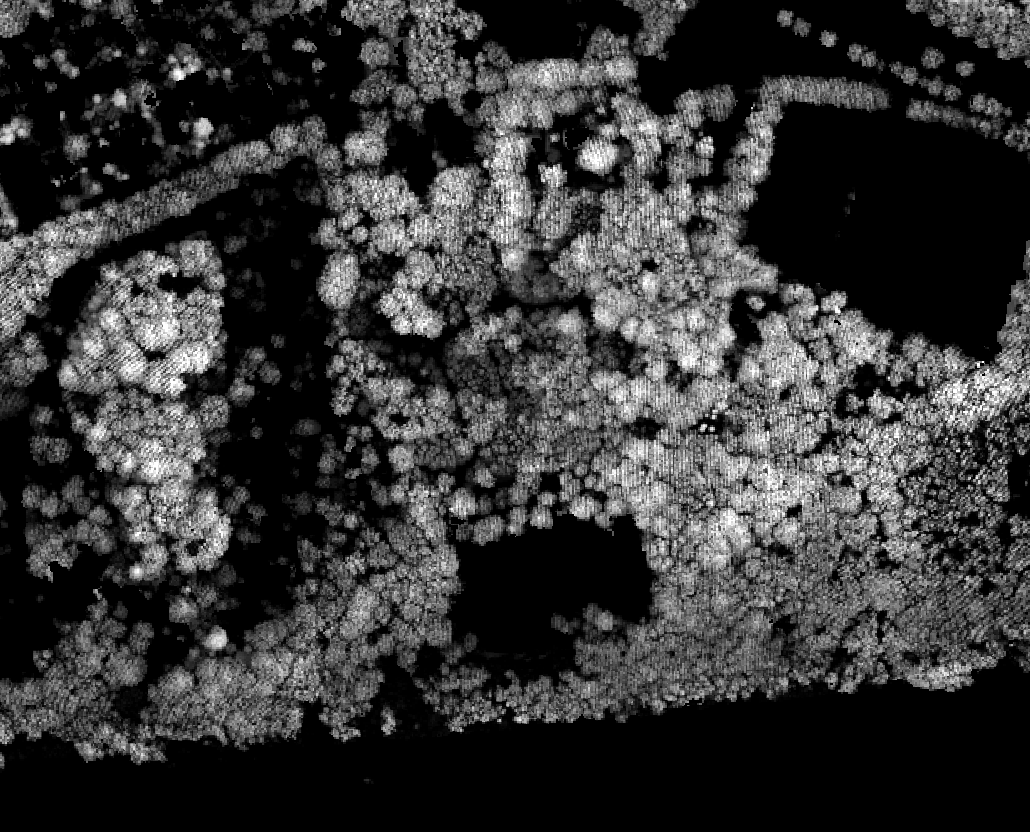
Zoomed in on the foliage height in Wageningen, east-south-east corner of the overview 


Calculation time
The calculation time of the PET overlay of 1 timeframe on a 1x1 meter grid for a 4x4km area of Wageningen is approximately 5 seconds.
See also



- Group
- Model attributes
- Daily average radiation • Daily average wind speed • Daily maximum temperature • Daily minimum temperature • Dates • Exclude buildings • Exclude water • Exclude foliage height m • Foliage areas • Hourly humidity • Hourly radiation • Hourly temperature • Max shadow distance • Sun altitude • Sun azimuth • Sun daily motion • Wind direction • Wind speed • Wind decline angle
- Group
- Building attributes
- Bowen ratio • Foliage height • Foliage crown factor • Vegetation fraction
- Terrain attributes
- Bowen ratio • Vegetation fraction
- Area attributes
- Foliage height
- Group
- Prequels
- Building elevation • Foliage height • Terrain elevation
- Related