How to make the Green Garden Indicator: Difference between revisions
No edit summary |
No edit summary |
||
| Line 3: | Line 3: | ||
==Steps== | ==Steps== | ||
===First steps=== | ===First steps=== | ||
The first step of designing the indicator existed out of defining the boundary conditions. Hereby you need to clearly define what do you want to get out of your indicator, in other words, what do you want it to show. Once this is clear you can start working towards shaping your indicator. The reason Amersfoort was chosen as the location for the digital twin, was because of the availability of data of neighbourhood composition. The neighbourhood Leusderkwartier and some other neighbourhoods where mapped by the municipality of Amersfoort in a previous | The first step of designing the indicator existed out of defining the boundary conditions. Hereby you need to clearly define what do you want to get out of your indicator, in other words, what do you want it to show. Once this is clear you can start working towards shaping your indicator. The reason Amersfoort was chosen as the location for the digital twin, was because of the availability of data of neighbourhood composition. The neighbourhood Leusderkwartier and some other neighbourhoods where mapped by the municipality of Amersfoort in a previous [https://www.stowa.nl/sites/default/files/assets/PUBLICATIES/Publicaties%202000-2010/Publicaties%202005-2009/STOWA%202009-02%20RIONED.pdf Case Study] about urban precipitation water. | ||
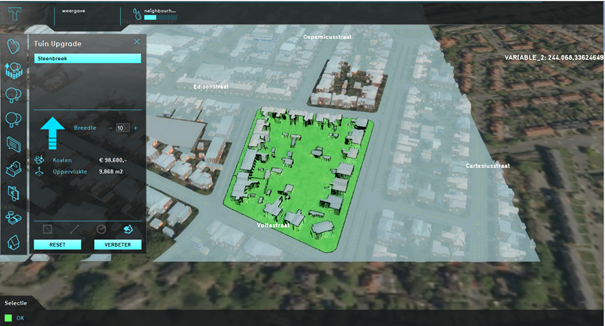
[[File:Use_case_piek.png|thumb|500px|right|Example of garden improvemenent in Leusderkwartier, Amersfoort.]] | [[File:Use_case_piek.png|thumb|500px|right|Example of garden improvemenent in Leusderkwartier, Amersfoort.]] | ||
===Setting up the parameters=== | ===Setting up the parameters=== | ||
| Line 41: | Line 41: | ||
===Defining the output=== | ===Defining the output=== | ||
The visible output of the indicator uses a HTML table to show the output. The values in the output are percentages, these percentages are obtained by dividing each value with the total area of the project. In the project [[Measures]] were created. During a [[session]], for example transforming a paved garden into a green garden could be done. Because the indicator both calculates the current and future design, the difference between those two parameters shows possible progress and what consequences of a certain measure can be. | The visible output of the indicator uses a HTML table to show the output. The values in the output are percentages, these percentages are obtained by dividing each value with the total area of the project. In the project [[Measures]] were created. During a [[session]], for example transforming a paved garden into a green garden could be done. Because the indicator both calculates the current and future design, the difference between those two parameters shows possible progress and what consequences of a certain measure can be. | ||
==Implementing the Indicator== | |||
The last step was using the step in a scenario session, herfor I needed as previously said adjust the standard garden of the platfrom, to make a distinction between paved and green gardens. The function values of the paved garden are now simular to those of an urban square. In the scenario created for the Amersfoort Green Garden Use Case, it was possible for inhabitants and the manucipality to ''upgrade'' their paved gardens to green garden. | |||
{{article end | {{article end | ||
Revision as of 10:48, 30 October 2020
This How-to will explain how the Indicator in the Neighbourhood Green Garden Meter use case was made and which steps were needed to create it. To succesfully impelemt this indicator, knowledge about the Tygron Query Language and the use of Excel in the Tygron platfrom.
Steps
First steps
The first step of designing the indicator existed out of defining the boundary conditions. Hereby you need to clearly define what do you want to get out of your indicator, in other words, what do you want it to show. Once this is clear you can start working towards shaping your indicator. The reason Amersfoort was chosen as the location for the digital twin, was because of the availability of data of neighbourhood composition. The neighbourhood Leusderkwartier and some other neighbourhoods where mapped by the municipality of Amersfoort in a previous Case Study about urban precipitation water.
Setting up the parameters
This case study by the municipality of Amersfoort gave a rough direction to the values the indicator had to show and also helped in the categorisation of the parameters. For the green garden use case, the five parameters that the indicator intends to measure are:
| Paved Areas | Green Areas |
|---|---|
| Roofs | |
| Garden (Paved) | Garden (Green) |
| Public Pavement | Public Green |
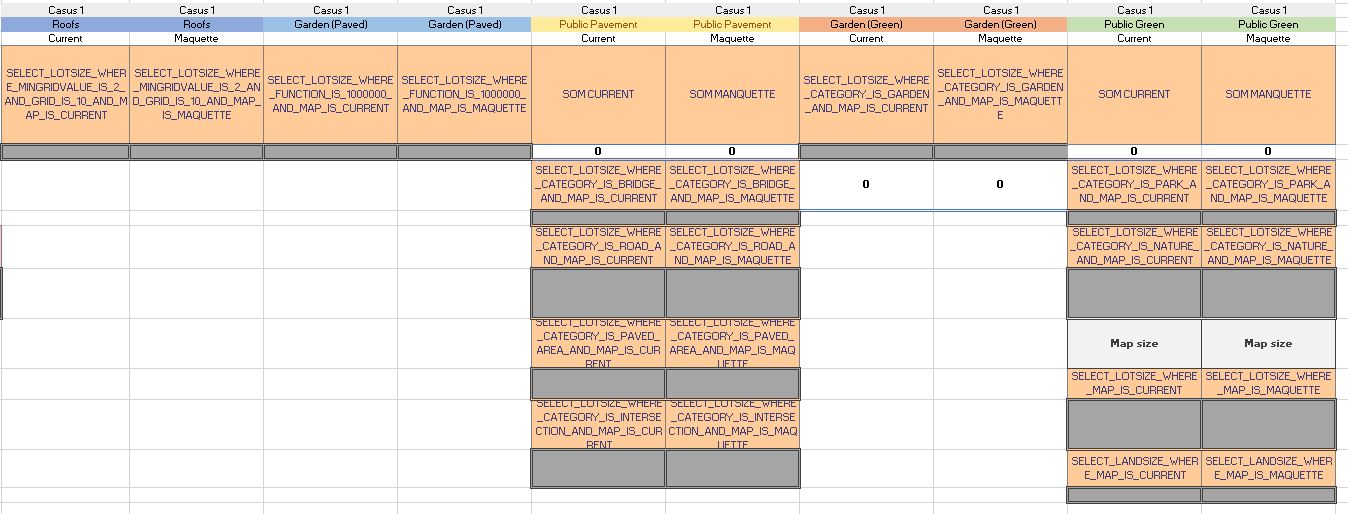
Hereby, the goal is that the values of the parameters are expressed in percentages of the total to be measured area of the digital twin. After defining the boundary conditions the next step is to translate the parameters into working queries. This is the step where the indicator gets shaped and defined. To understand the functioning of indicators better it can be useful to look at the set-up of other simular indicators, the Green Garden indicator was inspired partially on the Housing Indicator. This indicator shows some overlap in its fundamentals with the green garden indicator and was therefor chosen and some of its frameworks could be reused.
Queries
The final step of realising the indicator was defining the queries. An import tool with helping to shape indicators is the query tool. This tool can also directly shows the calculated outcomes of the query. The queries used in the Green Garden indicator are summed up below an explanation of their creation.
Roofs
The first step in shaping the indicator was setting up the query for the roofs. To obtain this information from the platform, the query selects all the Constructions in the 3D world with at least one floor (hence:FLOOR_HEIGH_M) and a minimum floor height of 2m. This floor height was obtained from the model, by making an Average Overlay based on the FLOOR_HEIGH_M attribute. This is also a useful tool to visualize the area that will be selected.
Garden (paved)
The paved garden parameter is based on a new Function made for this use case. Gardens in the Tygron Platform are by default green gardens, so this query obtains the area value of all the gardens. For paved gardens, a new garden type was created by duplicating a Function and editing the function values, .
Public Pavement
The third parameter is public pavement, this includes all the public hard surfaces, like sidewalks and roads. The query, therefore, is a SUM statement in Excel with all the public hard surfaces used in the 3D model of Leusderkwartier. These parameters included values of bridge, road, paved area and intersections.
Garden (green)
As explained above, green gardens are currently the default type of garden in the Tygron Platform. This query, therefore, obtains the lotsize of all the gardens in the model. Subsequently, the area value of the paved garden is substracted of this total.
Public Green
The last category is public green, this category is also a sum function. This parameter sums the surfaces of the categories parks and nature and also add the area of terrain that has no function, this is often grassland. By subtracting the total area with the total built environment, the difference will show the undeveloped land.
Defining the output
The visible output of the indicator uses a HTML table to show the output. The values in the output are percentages, these percentages are obtained by dividing each value with the total area of the project. In the project Measures were created. During a session, for example transforming a paved garden into a green garden could be done. Because the indicator both calculates the current and future design, the difference between those two parameters shows possible progress and what consequences of a certain measure can be.
Implementing the Indicator
The last step was using the step in a scenario session, herfor I needed as previously said adjust the standard garden of the platfrom, to make a distinction between paved and green gardens. The function values of the paved garden are now simular to those of an urban square. In the scenario created for the Amersfoort Green Garden Use Case, it was possible for inhabitants and the manucipality to upgrade their paved gardens to green garden.

