Average calculation model (Heat Overlay): Difference between revisions
Jump to navigation
Jump to search
mNo edit summary |
mNo edit summary |
||
| Line 18: | Line 18: | ||
| [[File:Average window wind (Heat Overlay).png|250px|thumb|1100x500 meters, centered at 1000x250x100x250]] | | [[File:Average window wind (Heat Overlay).png|250px|thumb|1100x500 meters, centered at 1000x250x100x250]] | ||
|- | |- | ||
| {{anchor|Small window| | | {{anchor|Small window|Small window}} | ||
| | | | ||
* Wind speed, based on the [[Wind calculation model (Heat Overlay)|wind direction]] configured as [[Wind speed (Heat Overlay)|wind speed]] parameter for the Overlay's calculation. | * Wind speed, based on the [[Wind calculation model (Heat Overlay)|wind direction]] configured as [[Wind speed (Heat Overlay)|wind speed]] parameter for the Overlay's calculation. | ||
Revision as of 13:58, 18 December 2019
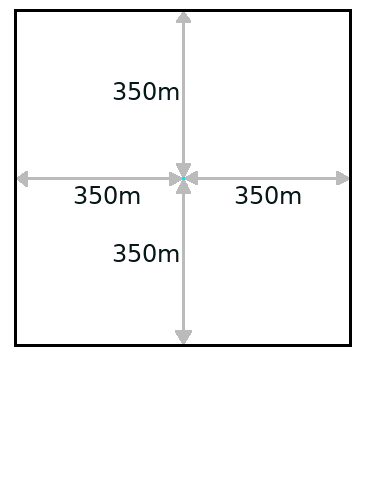
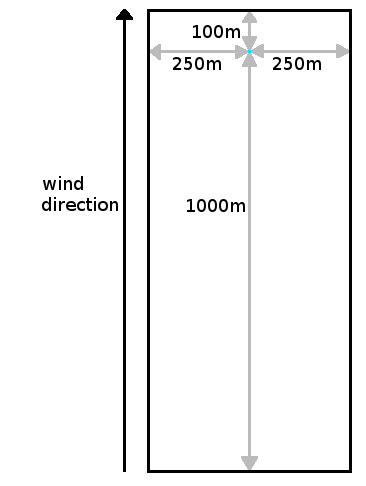
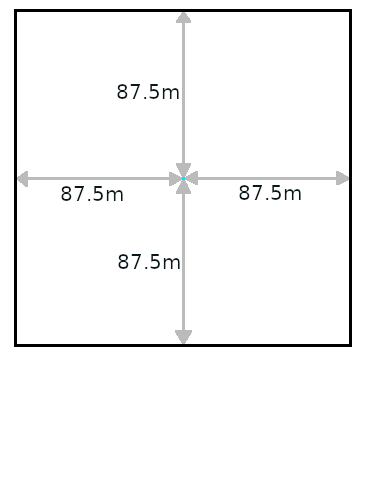
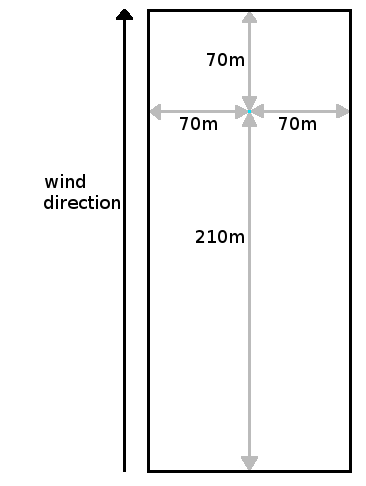
The wind speed and direction, measured at a weather station, are used to determine the window for averaging values around a cell. In calculations with a low wind speed, an cell-centered averaging window is used. In calculations with a high wind speed, an oblong rectangle is used for averaging, with the cell in question offset towards the far side along the line of the wind direction.
Wind speed:
- < 1.5 meter per second, the window is square and cell centered
- >= 1.5 meter per second, the window is oblong.
| Window | Model | Low wind speeds | High wind speeds |
|---|---|---|---|
| Large window |
|
||
| Small window |
|
See also


